Guide
MeanShift
- python:
git clone https://github.com/mattnedrich/MeanShift_py.git - cpp:
git https://github.com/mattnedrich/MeanShift_cpp.git
cpp compile
1 | cd MeanShfit_cpp |
Visualization for linux
1 | sudo apt-get install gnuplot gnuplot-qt |
gnuplot
plot ‘test.csv’ with points, ‘result.csv’ with points
python demo
1 | import mean_shift as ms |
meanshift_py
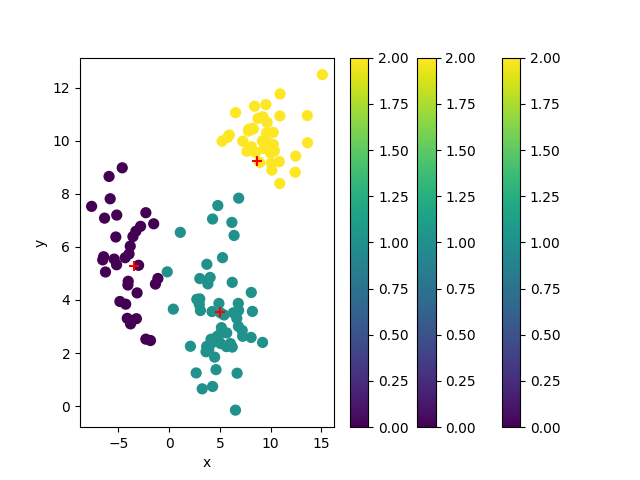
#===============================
# ms
#===============================
('data.shape=', (125, 2))
('original_points.shape=', (125, 2))
[[10.91079039  8.38941202]
 [ 9.87500165  9.9092509 ]
 [ 7.8481223  10.4317483 ]
 [ 8.53412293  9.55908561]
 [10.38316846  9.61879086]
 [ 8.11061595  9.77471761]
 [10.02119468  9.53877962]
 [ 9.37705852  9.70853991]
 [ 7.67017034  9.60315231]
 [10.94308287 11.76207349]]
('cluster_centers.shape=', (3, 2))
[[-3.45216026  5.28851174]
 [ 5.02926925  3.56548696]
 [ 8.63149568  9.25488818]]
('cluster_ids.shape=', (125,))
[2 2 2 2 2 2 2 2 2 2 2 2 2 2 2 2 2 2 1 1 2 2 2 2 2 2 2 2 2 2 2 2 2 2 2 2 2
 2 2 2 1 1 1 1 1 1 1 1 1 1 1 1 1 1 1 1 1 1 1 1 1 1 1 1 1 1 1 1 1 1 1 1 1 1
 1 1 1 1 1 1 1 1 1 1 1 1 1 1 1 1 0 0 0 0 1 0 0 0 0 0 0 0 0 0 0 0 0 0 0 0 0
 0 0 0 0 0 0 0 0 0 0 1 0 0 0]
('unique_ids.shape=', (3,))
[0 1 2]
OK 2_ms
sklearn
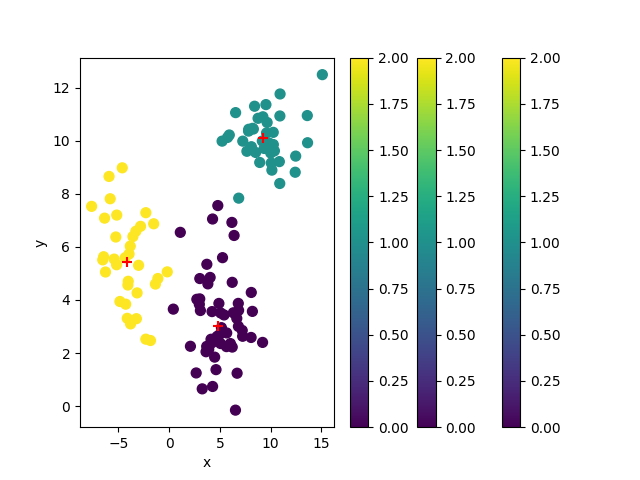
#===============================
# sklearn
#===============================

('data.shape=', (125, 2))
('original_points.shape=', (125, 2))
[[10.91079039  8.38941202]
 [ 9.87500165  9.9092509 ]
 [ 7.8481223  10.4317483 ]
 [ 8.53412293  9.55908561]
 [10.38316846  9.61879086]
 [ 8.11061595  9.77471761]
 [10.02119468  9.53877962]
 [ 9.37705852  9.70853991]
 [ 7.67017034  9.60315231]
 [10.94308287 11.76207349]]
('cluster_centers.shape=', (3, 2))
[[ 4.79792283  3.01140269]
 [ 9.2548292  10.11312163]
 [-4.11368202  5.44826076]]
('cluster_ids.shape=', (125,))
[1 1 1 1 1 1 1 1 1 1 1 1 1 1 1 1 1 1 0 1 1 1 1 1 1 1 1 1 1 1 1 1 1 1 1 1 1
 1 1 1 0 0 0 0 0 0 0 0 0 0 0 0 0 0 0 0 0 0 0 0 0 0 0 0 0 0 0 0 0 0 0 0 0 0
 0 0 0 0 0 0 0 0 0 0 0 0 0 0 0 0 2 2 2 2 2 2 2 2 2 2 2 2 2 2 2 2 2 2 2 2 2
 2 2 2 2 2 2 2 2 2 2 0 2 2 2]
('unique_ids.shape=', (3,))
[0 1 2]
OK 1_sklearn
Reference
History
- 20190318: created.