Guide
MeanShift
- python:
git clone https://github.com/mattnedrich/MeanShift_py.git - cpp:
git https://github.com/mattnedrich/MeanShift_cpp.git
cpp compile
cd MeanShfit_cpp
mkdir build && cd build && cmake .. && make -j8

./MeanShift_cpp
Visualization for linux
sudo apt-get install gnuplot gnuplot-qt
gnuplot
plot ‘test.csv’ with points, ‘result.csv’ with points
python demo
import mean_shift as ms
import matplotlib.pyplot as plt
import numpy as np

def ms_cluster(data):
        # case(1) demo:     kernel_bandwidth = 3.0, cluster_epsilon = 6
        # case(2) laneseg:  kernel_bandwidth = 0.5, cluster_epsilon = 2
        mean_shifter = ms.MeanShift()
        mean_shift_result = mean_shifter.cluster(data, kernel_bandwidth = 3, cluster_epsilon= 6)
        return mean_shift_result

def sklearn_cluster(data):
        from sklearn.cluster import MeanShift
        from sklearn.cluster import estimate_bandwidth

        bandwidth = estimate_bandwidth(data, quantile=0.2, n_samples=data.shape[0])
        #print("bandwidth=",bandwidth) # 3
        mean_shifter = MeanShift(bandwidth, bin_seeding=True)
        mean_shifter.fit(data)

        # get same results
        original_points = data
        cluster_centers = mean_shifter.cluster_centers_
        cluster_ids = mean_shifter.labels_

        mean_shift_result = ms.MeanShiftResult(original_points, cluster_centers, cluster_ids)
        return mean_shift_result

def cluster_api(data, use_sklearn=True):
        if use_sklearn:
                return sklearn_cluster(data)
        else:
                return ms_cluster(data)

def print_cluster_result(mean_shift_result):
        print("Original Point     Shifted Point  Cluster ID")
        print("============================================")
        for i in range(len(mean_shift_result.original_points)): # 125
                original_point = mean_shift_result.original_points[i] # 125
                cluster_id = mean_shift_result.cluster_ids[i] # 125  value=0,1,2
                cluster_center = mean_shift_result.cluster_centers[cluster_id] # 3

                print(
                        "(%5.2f,%5.2f) ->  (%5.2f,%5.2f) cluster %i" %
                        (original_point[0], original_point[1],
                        cluster_center[0], cluster_center[1],
                        cluster_id)
                )
        print("============================================")

def main():

        use_sklearn = True
        data = np.genfromtxt('data.csv', delimiter=',')
        print("data.shape=",data.shape)

        mean_shift_result = cluster_api(data,use_sklearn)
        #print_cluster_result(mean_shift_result)

        original_points =  mean_shift_result.original_points # (125, 2)
        cluster_centers = mean_shift_result.cluster_centers  # (3, 2)
        cluster_ids = mean_shift_result.cluster_ids # (125,)   value=[0,1,2]

        unique_ids = np.unique(cluster_ids) # (3,)  value=[0,1,2]

        print("original_points.shape=",original_points.shape) # (125, 2)
        print(original_points[:10])

        print("cluster_centers.shape=",cluster_centers.shape) # (3, 2)
        print(cluster_centers)

        print("cluster_ids.shape=",cluster_ids.shape) # (125,)
        print(cluster_ids) # [0,0,0,...1,1,1,...,2,2,2,...] 0,1,2 cluster ids

        print("unique_ids.shape=",unique_ids.shape) # (3,)
        print(unique_ids)  # 0,1,2

        x = original_points[:,0]
        y = original_points[:,1]

        fig = plt.figure()
        ax = fig.add_subplot(111)
        scatter = ax.scatter(x,y,c=cluster_ids,s=50)
        for cx,cy in cluster_centers:
                ax.scatter(cx,cy,s=50,c='red',marker='+')
                ax.set_xlabel('x')
                ax.set_ylabel('y')
                plt.colorbar(scatter)

        if use_sklearn:
                filename = "1_sklearn"
        else:
                filename = "2_ms"

        fig.savefig(filename)
        plt.show()
        print("OK "+filename)

if __name__ == "__main__":
        main()
meanshift_py
#===============================
# ms
#===============================
('data.shape=', (125, 2))
('original_points.shape=', (125, 2))
[[10.91079039 8.38941202]
[ 9.87500165 9.9092509 ]
[ 7.8481223 10.4317483 ]
[ 8.53412293 9.55908561]
[10.38316846 9.61879086]
[ 8.11061595 9.77471761]
[10.02119468 9.53877962]
[ 9.37705852 9.70853991]
[ 7.67017034 9.60315231]
[10.94308287 11.76207349]]
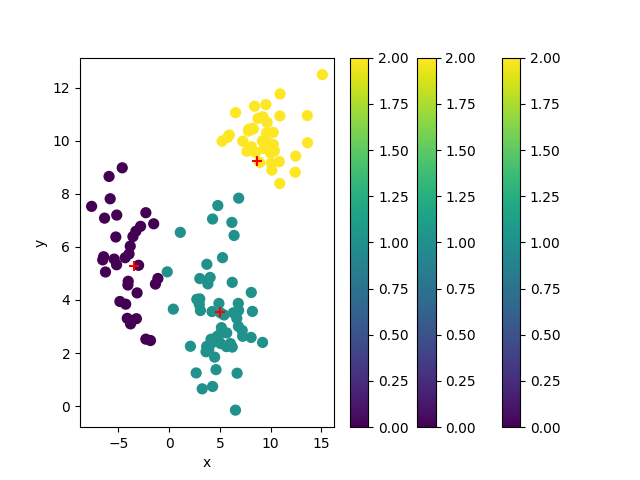
('cluster_centers.shape=', (3, 2))
[[-3.45216026 5.28851174]
[ 5.02926925 3.56548696]
[ 8.63149568 9.25488818]]
('cluster_ids.shape=', (125,))
[2 2 2 2 2 2 2 2 2 2 2 2 2 2 2 2 2 2 1 1 2 2 2 2 2 2 2 2 2 2 2 2 2 2 2 2 2
2 2 2 1 1 1 1 1 1 1 1 1 1 1 1 1 1 1 1 1 1 1 1 1 1 1 1 1 1 1 1 1 1 1 1 1 1
1 1 1 1 1 1 1 1 1 1 1 1 1 1 1 1 0 0 0 0 1 0 0 0 0 0 0 0 0 0 0 0 0 0 0 0 0
0 0 0 0 0 0 0 0 0 0 1 0 0 0]
('unique_ids.shape=', (3,))
[0 1 2]
OK 2_ms
sklearn
#===============================
# sklearn
#===============================
('data.shape=', (125, 2))
('original_points.shape=', (125, 2))
[[10.91079039 8.38941202]
[ 9.87500165 9.9092509 ]
[ 7.8481223 10.4317483 ]
[ 8.53412293 9.55908561]
[10.38316846 9.61879086]
[ 8.11061595 9.77471761]
[10.02119468 9.53877962]
[ 9.37705852 9.70853991]
[ 7.67017034 9.60315231]
[10.94308287 11.76207349]]
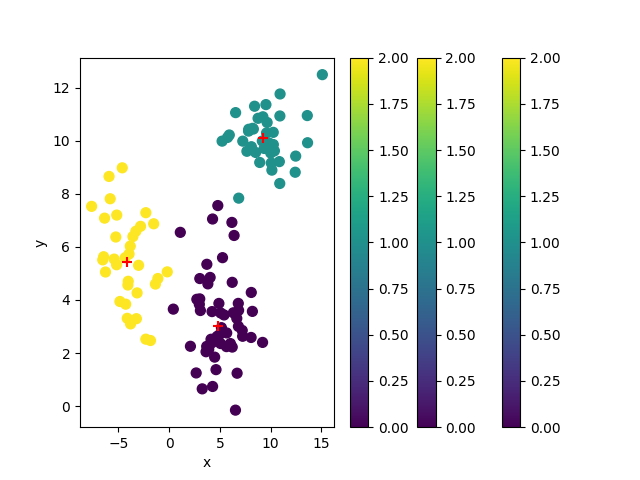
('cluster_centers.shape=', (3, 2))
[[ 4.79792283 3.01140269]
[ 9.2548292 10.11312163]
[-4.11368202 5.44826076]]
('cluster_ids.shape=', (125,))
[1 1 1 1 1 1 1 1 1 1 1 1 1 1 1 1 1 1 0 1 1 1 1 1 1 1 1 1 1 1 1 1 1 1 1 1 1
1 1 1 0 0 0 0 0 0 0 0 0 0 0 0 0 0 0 0 0 0 0 0 0 0 0 0 0 0 0 0 0 0 0 0 0 0
0 0 0 0 0 0 0 0 0 0 0 0 0 0 0 0 2 2 2 2 2 2 2 2 2 2 2 2 2 2 2 2 2 2 2 2 2
2 2 2 2 2 2 2 2 2 2 0 2 2 2]
('unique_ids.shape=', (3,))
[0 1 2]
OK 1_sklearn
Reference
History
- 20190318: created.