Linear Algebra
determinant
basic

determinant properties
online calculator
inverse/adjoint(adjugate) matrix
Only non-singular matrices have inverses. (det(A) != 0)
- minor matrix
- cofactor matrix
- adjoint/adjugate matrix
- inverse matrix
- conjugate matrix
eigenvalue/eigenvector
An*n
graph demo
eigenvector
eigenvector steps
svd
singular value decomposition
Am*n (m!=n)
svd
Probability Theory
random variable: discrete/continuous
- probability mass function: pmf (possion, binomial distribution ) for discrete random variable
- probability density function: pdf (normal,uniform) for contiunous random variable
- cumulative distribution function: cdf for discrete+contiunous random variable
see pmf-cdf-pdf
distribution-function-terminology-pdf-cdf-pmf-etc
binomial: n times Bernoulli trial, P(x=k)=C(n,k)* p^k * (1-p)^(n-k)
- marginal probability
- joint probability
- conditional probability
- bayes theorem
see here
Marginal probability: the probability of an event occurring (p(A)), it may be thought of as an unconditional probability. It is not conditioned on another event. Example: the probability that a card drawn is red (p(red) = 0.5). Another example: the probability that a card drawn is a 4 (p(four)=1/13).
Joint probability: p(A and B). The probability of event A and event B occurring. It is the probability of the intersection of two or more events. The probability of the intersection of A and B may be written p(A ∩ B). Example: the probability that a card is a four and red =p(four and red) = 2/52=1/26. (There are two red fours in a deck of 52, the 4 of hearts and the 4 of diamonds).
Conditional probability: p(A|B) is the probability of event A occurring, given that event B occurs. Example: given that you drew a red card, what’s the probability that it’s a four (p(four|red))=2/26=1/13. So out of the 26 red cards (given a red card), there are two fours so 2/26=1/13.
bayes theorem: p(cancer)=0.01, p(positive test|cancer)=0.9, p(positive test|no cancer)=0.08
p(cancer|positive test)?
basic-prob
Statistics
2 types of statistics
- descriptive statistics 描述性统计值
- inferential statistics 推理性统计值
descriptive statistics
basic
- n, sum, min,max, range =max-min,
- mean,median,mode
- variance,standard deviation
- skewness,kurtosis
from mean,median,mode
mean/median/mode
- mean: regular meaning of “average”
- median: middle value
- mode: most often
2 types of data set: here
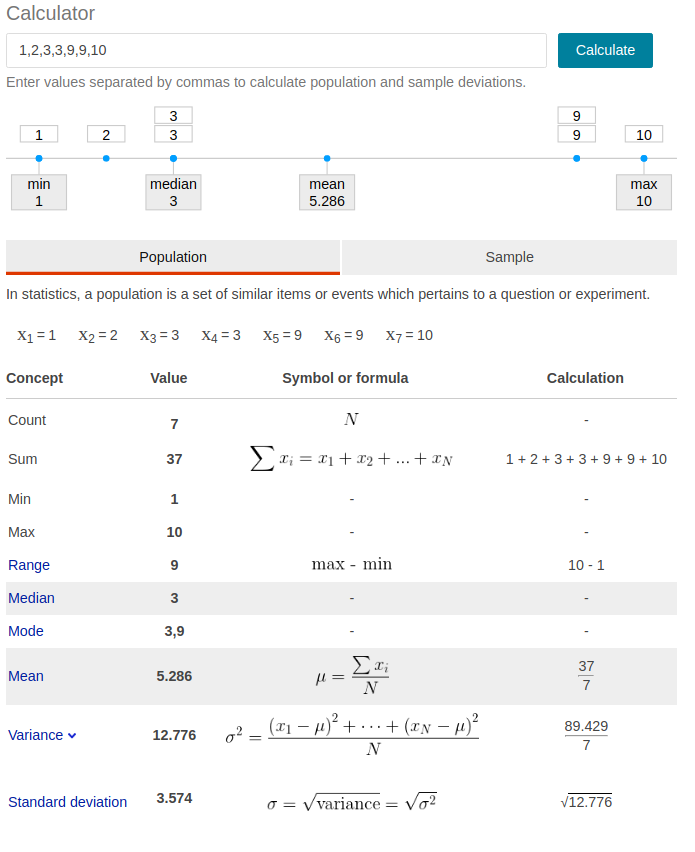
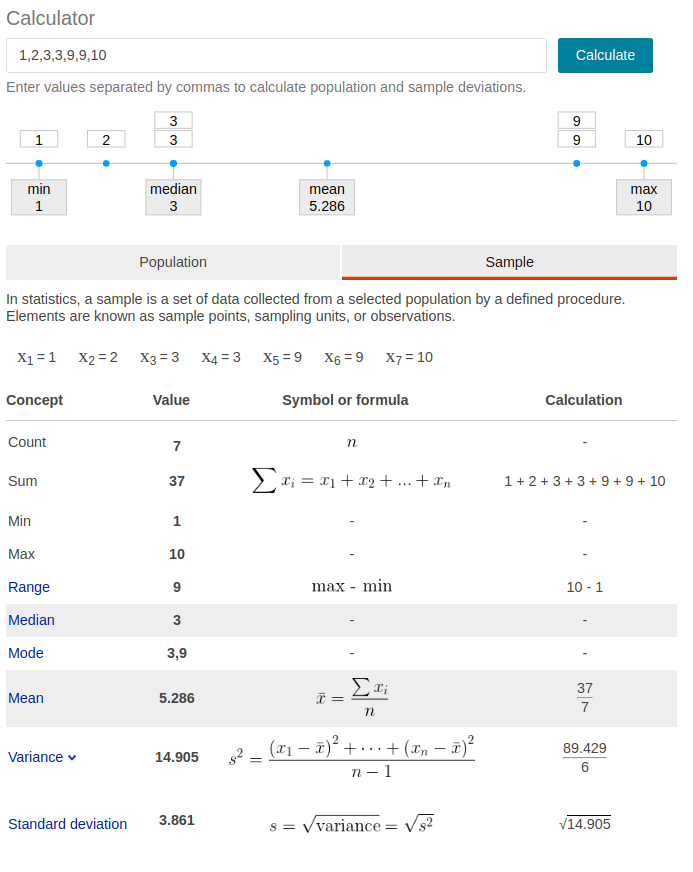
- population: u,sigma^2, sigma —> parameter
- sample: x, s^2, s —> statistic
population是总体,总体的数据是不变的,u就代表总体真实的均值;
sample是样本,我们总体的数据很难得到,必须借助样本猜测总体的情况,但是每次采样的时候会有不同,因此x拔表示一次采样的均值;
不同采样的均值x往往不同,但是总体均值u一定是不变的。
population
sample
see example
skewness vs kurtosis
- skewness: 偏度 the degree of symmetry
- kurtosis: 峰度 the degree of peakedness/flatness
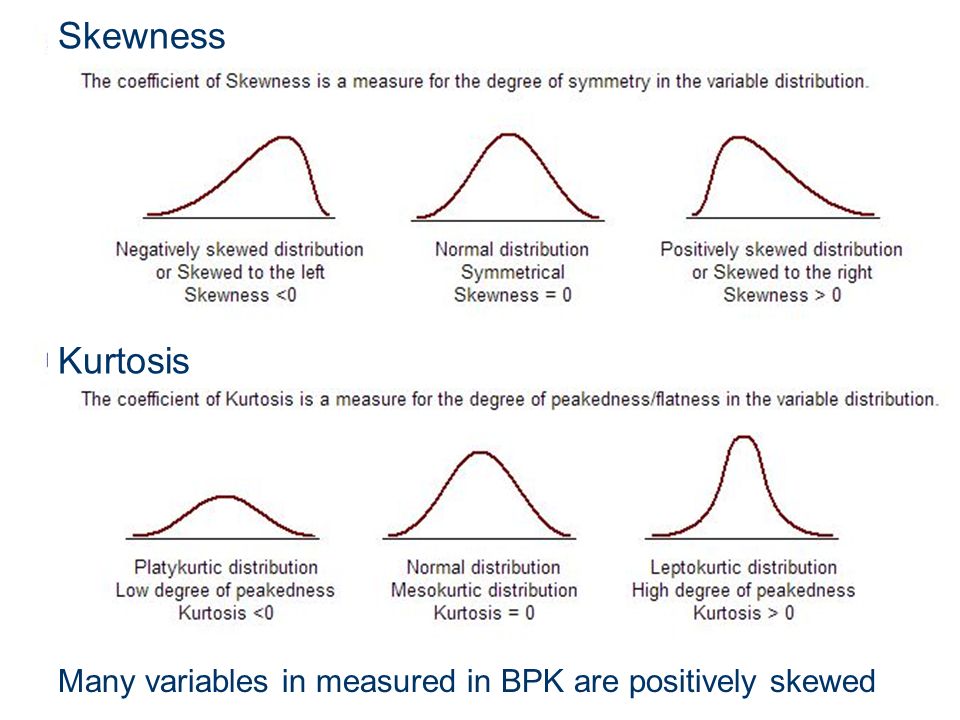
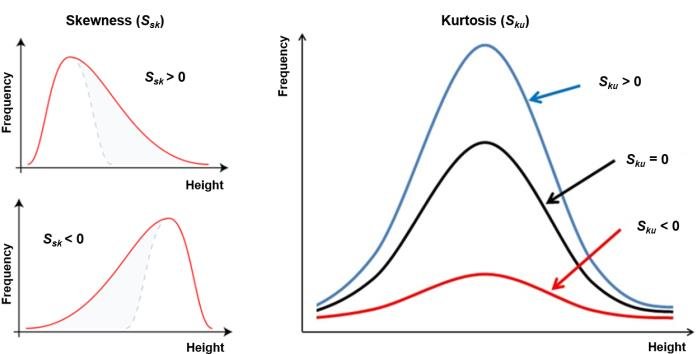
formula see skewness kurtosis formula
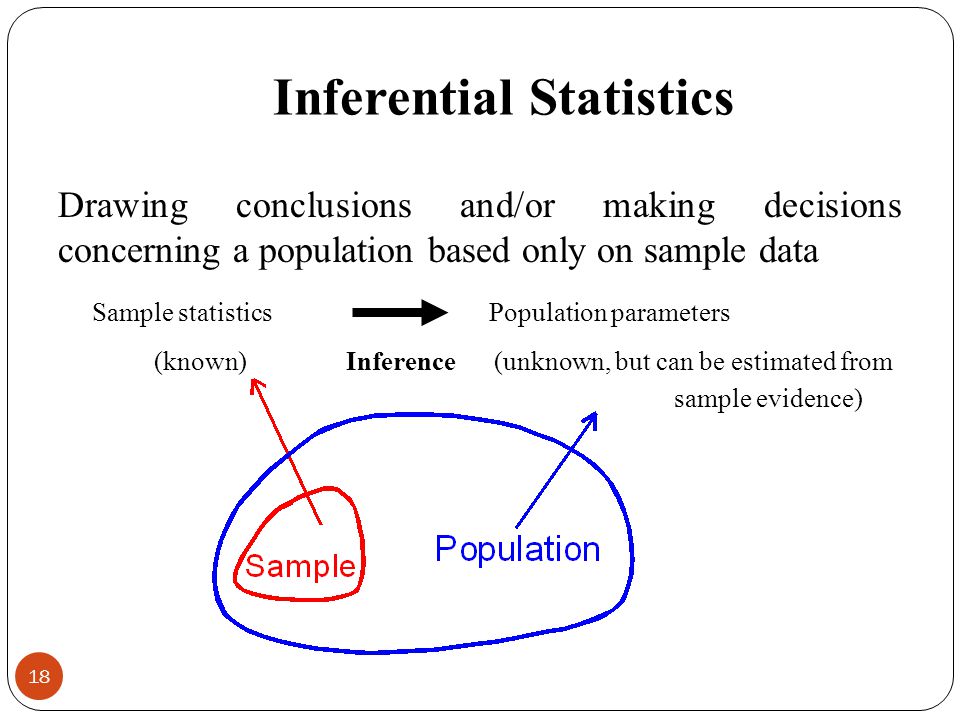
inferential statistics
Each hypothesis: null hypothesis + an alternative hypothesis.
- H0: u1=u2=u3=…=un. it indicates that the group means for the various groups are NOT very different from each other based on statistical significance levels.
- Ha: there exists at least two group means that are statistically significantly different from each other.
significance tests 显著性检验
- H0: there is NO real difference
- Ha: there is a difference
Reject H0 at 5% significant level if p-value<5%, statistical significant
Reject H0 at 1% significant level if p-value<1%, highly significant
one-tailed tests vs two-tailed tests
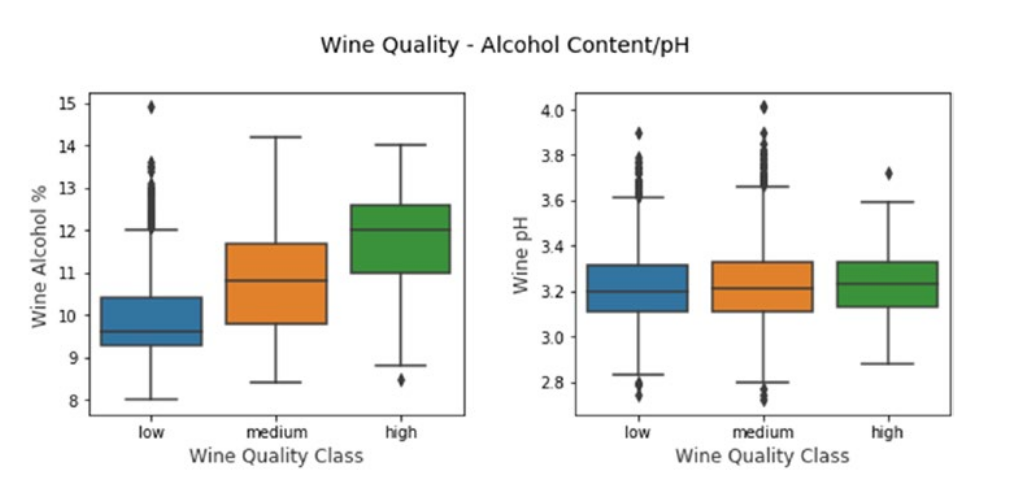
one-way ANOVA test:
- if p-value<=5%, the result is statistically significant different, we reject the null hypothesis in favor of the alternative hypothesis. (Ha was correct)
- Otherwise, if the results is not statistically significant, we conclude that our null hypothesis was correct. (H0 was correct)
demo
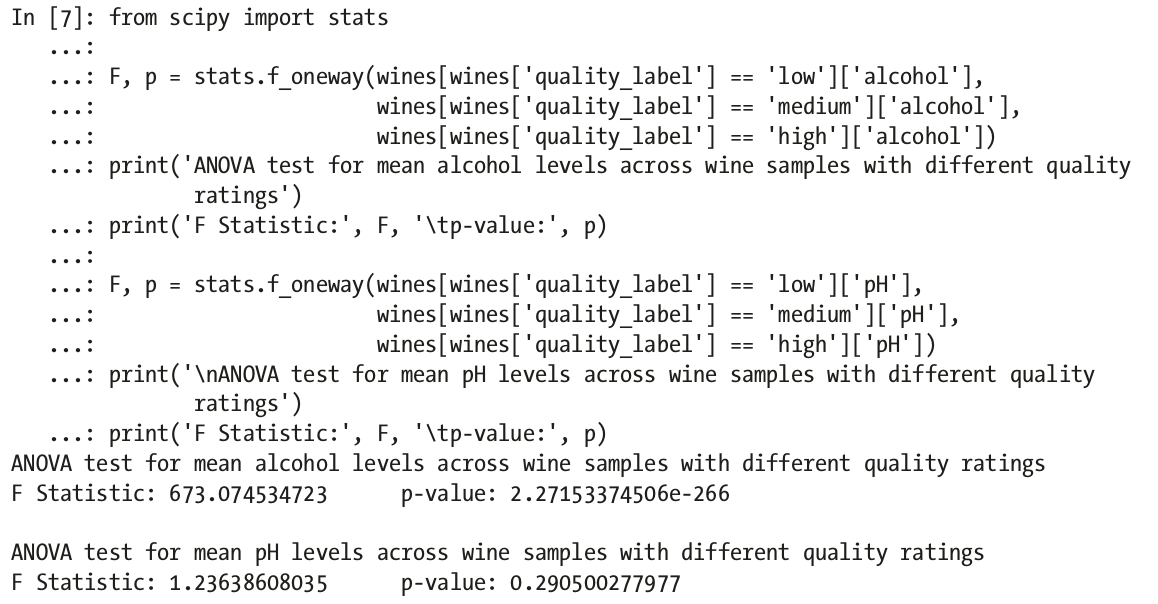
F-stat>4.737 or p-value<0.05, then reject H0
parametric tests vs nonparametric tests 参数检验 vs 非参数检验
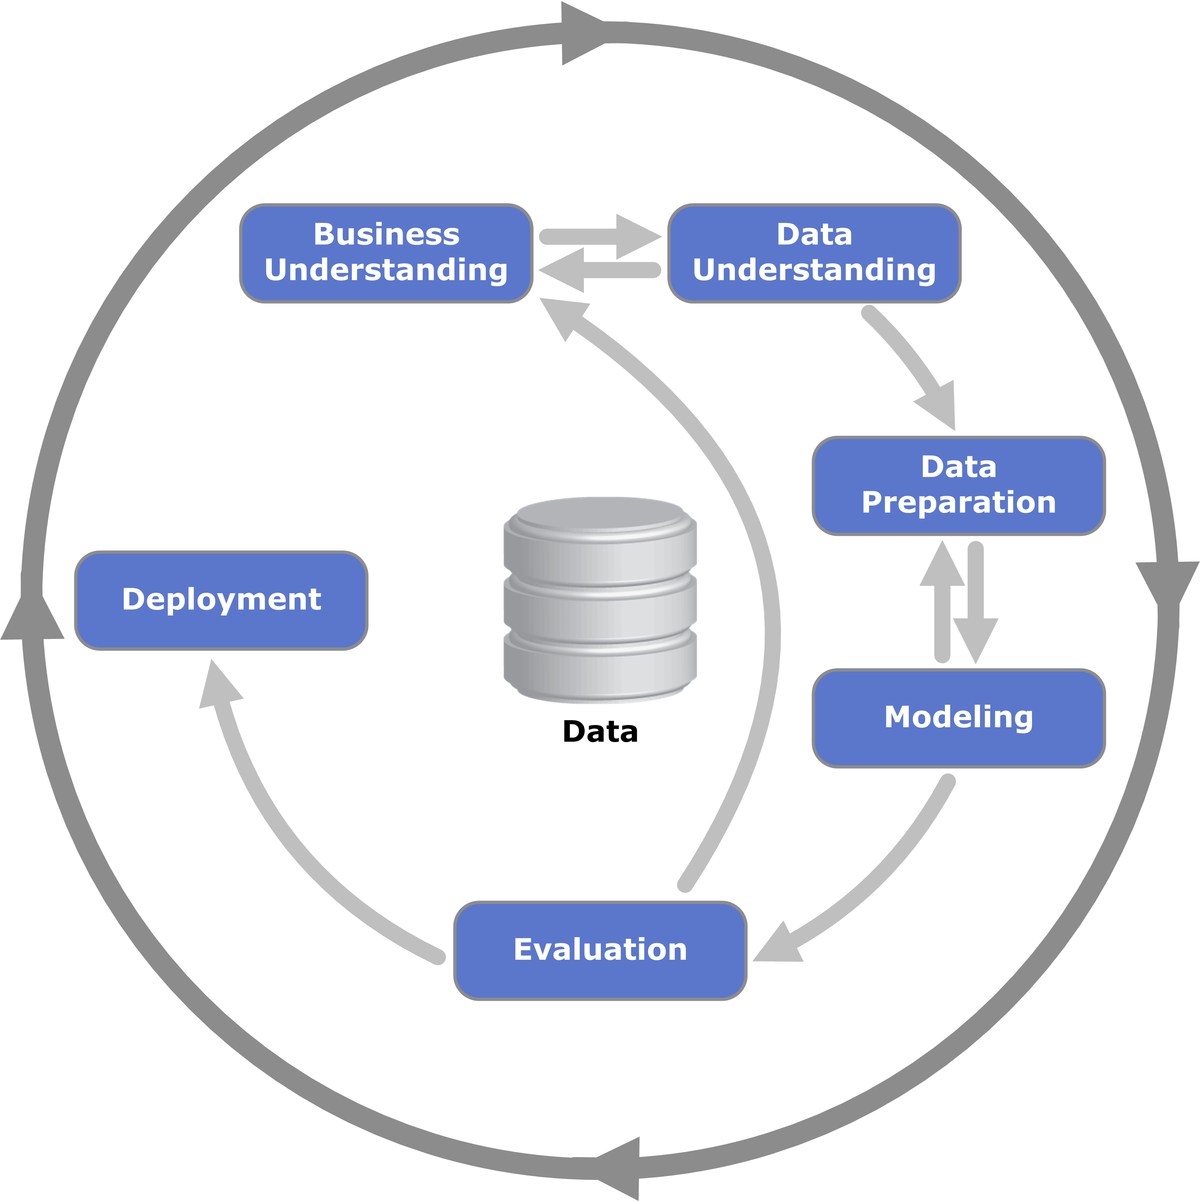
Data Mining
- KDD: knowledge discovery of dataset
- CRISP-DM: cross-industry standard process for data mining 跨行业数据挖掘标准流程
Machine Learning methods
with/without labels
- supervised learning:
- classification
- regression
- unsupervised learning
- clustering
- dimensionality reduction
- anomaly detection
- assiciation rule-mining/market basket analysis(购物篮分析)
- semi-supervised learning
- reinforcement learning
online/offline
- batch learning/offline learning
- online learning
instance/model
- instance based learning
- model based learning
EDA
statistics
- descriptive statistics
- inferential statistics
analysis
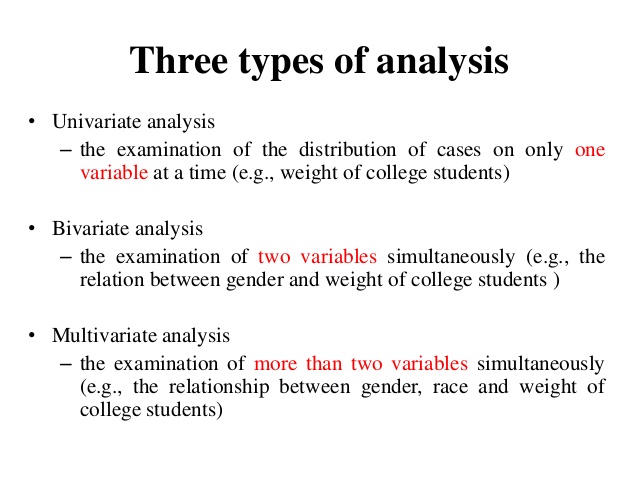
3 types
- univariate analysis: n=1
- bivariate analysis: n=2
- multivariate analysis: n>=3
- use histogram to visualize data
- correlation matrix/heatmap
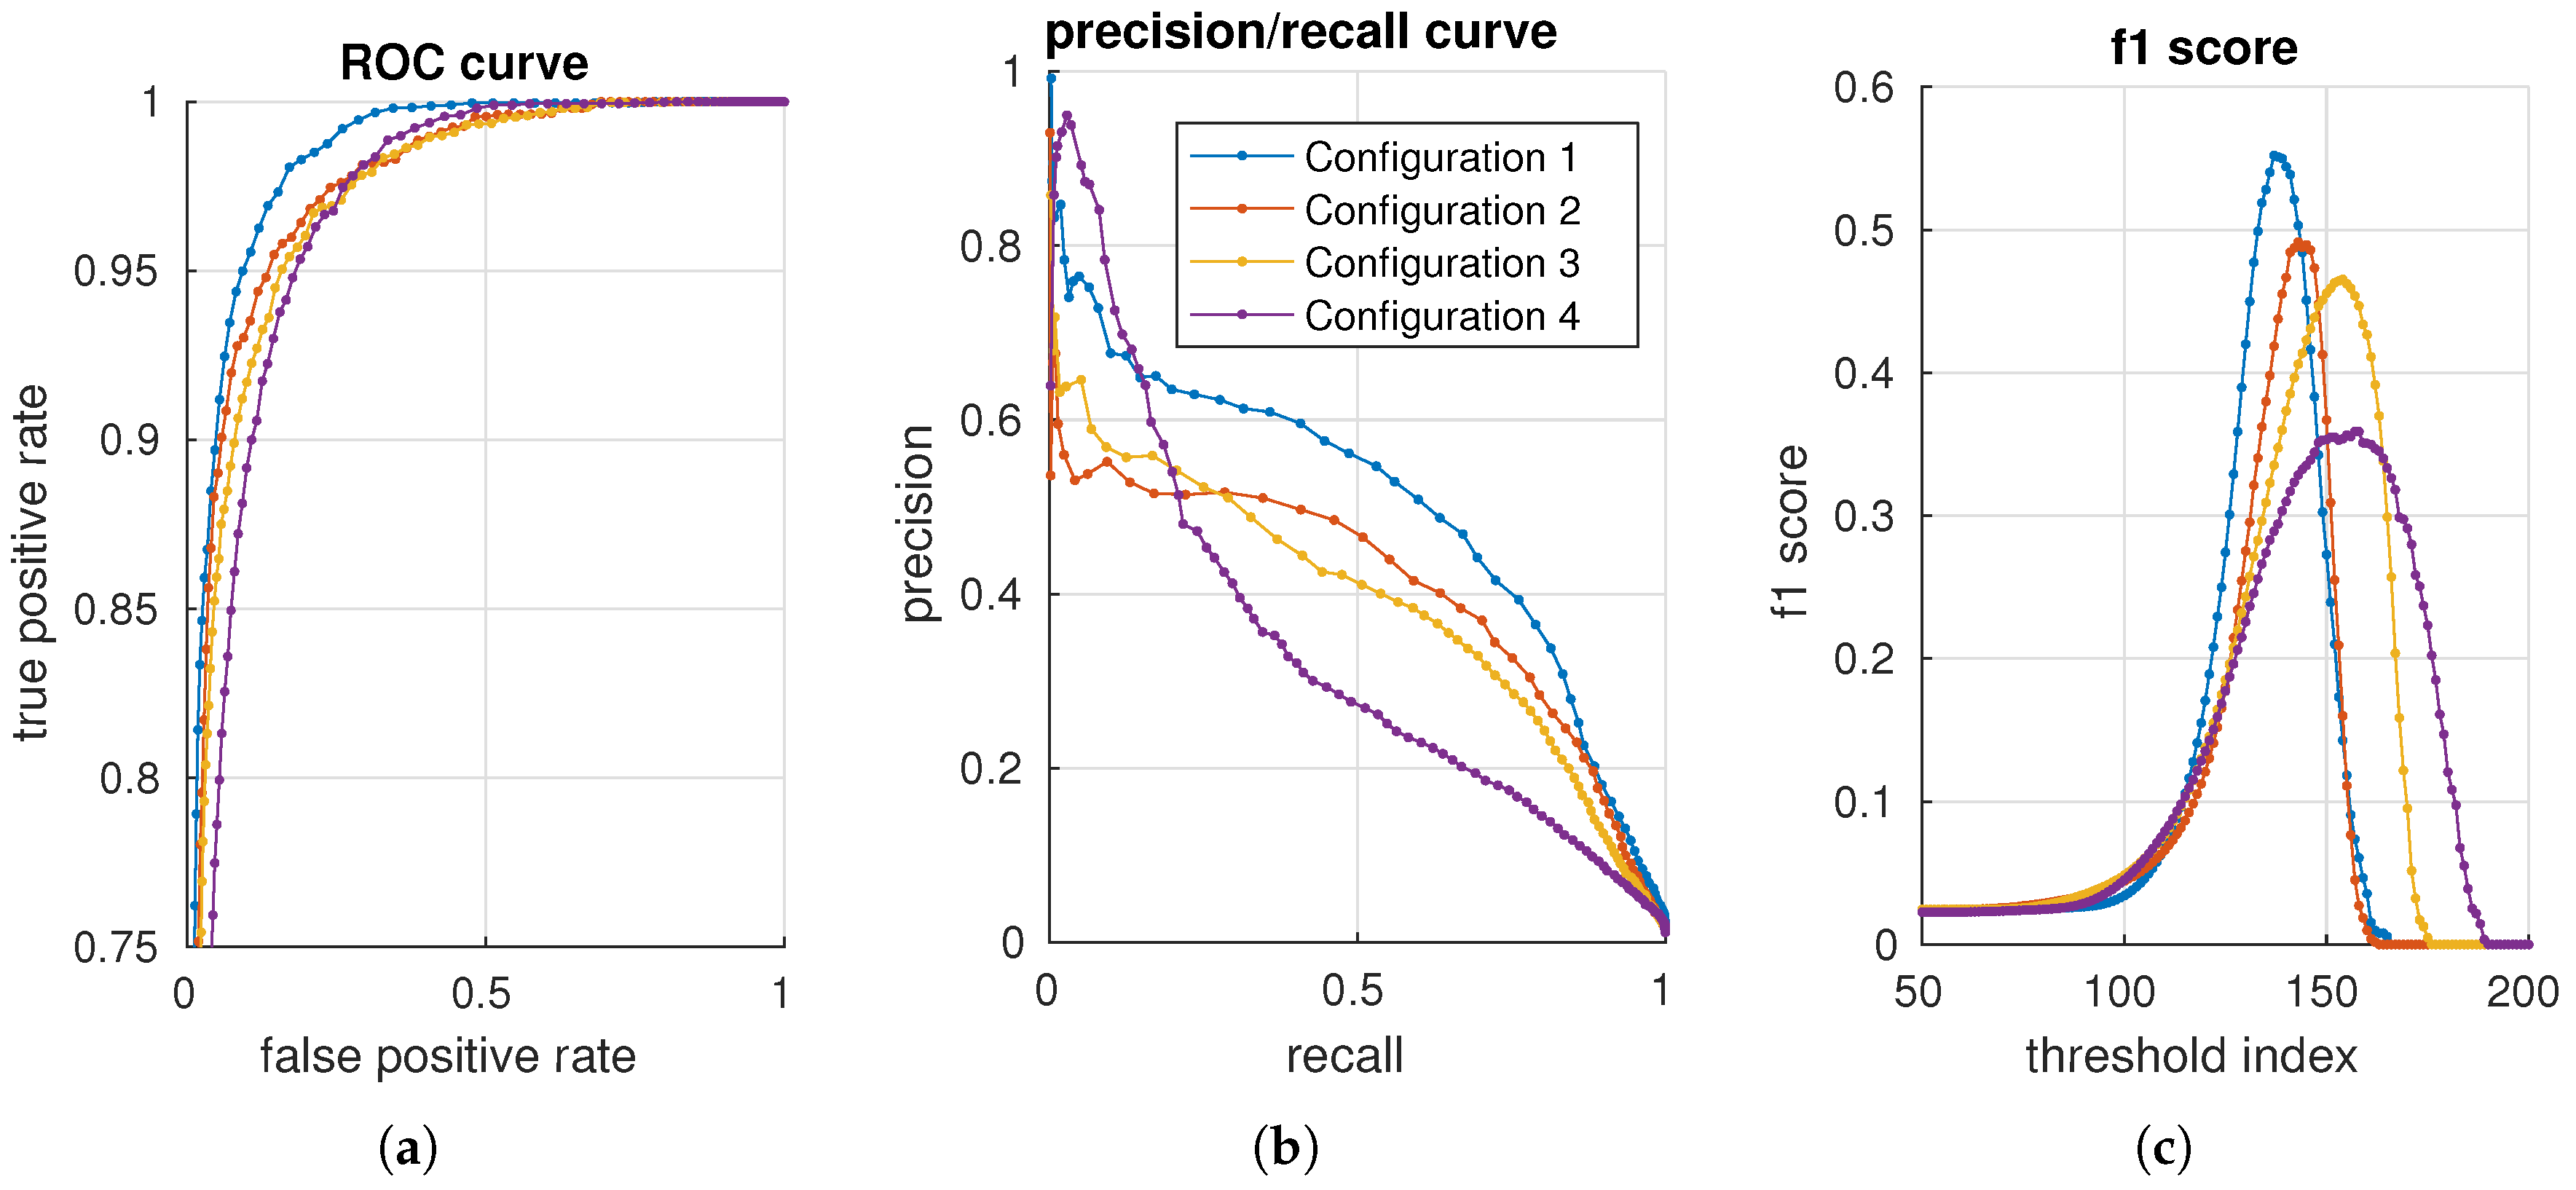
Model Evaluation
Classification
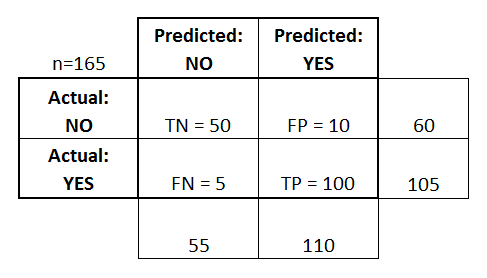
confusion matrix
- accuracy
- precision
- recall
- F1-score: harmonic mean 调和平均值
value range (0-1), the bigger, the better.
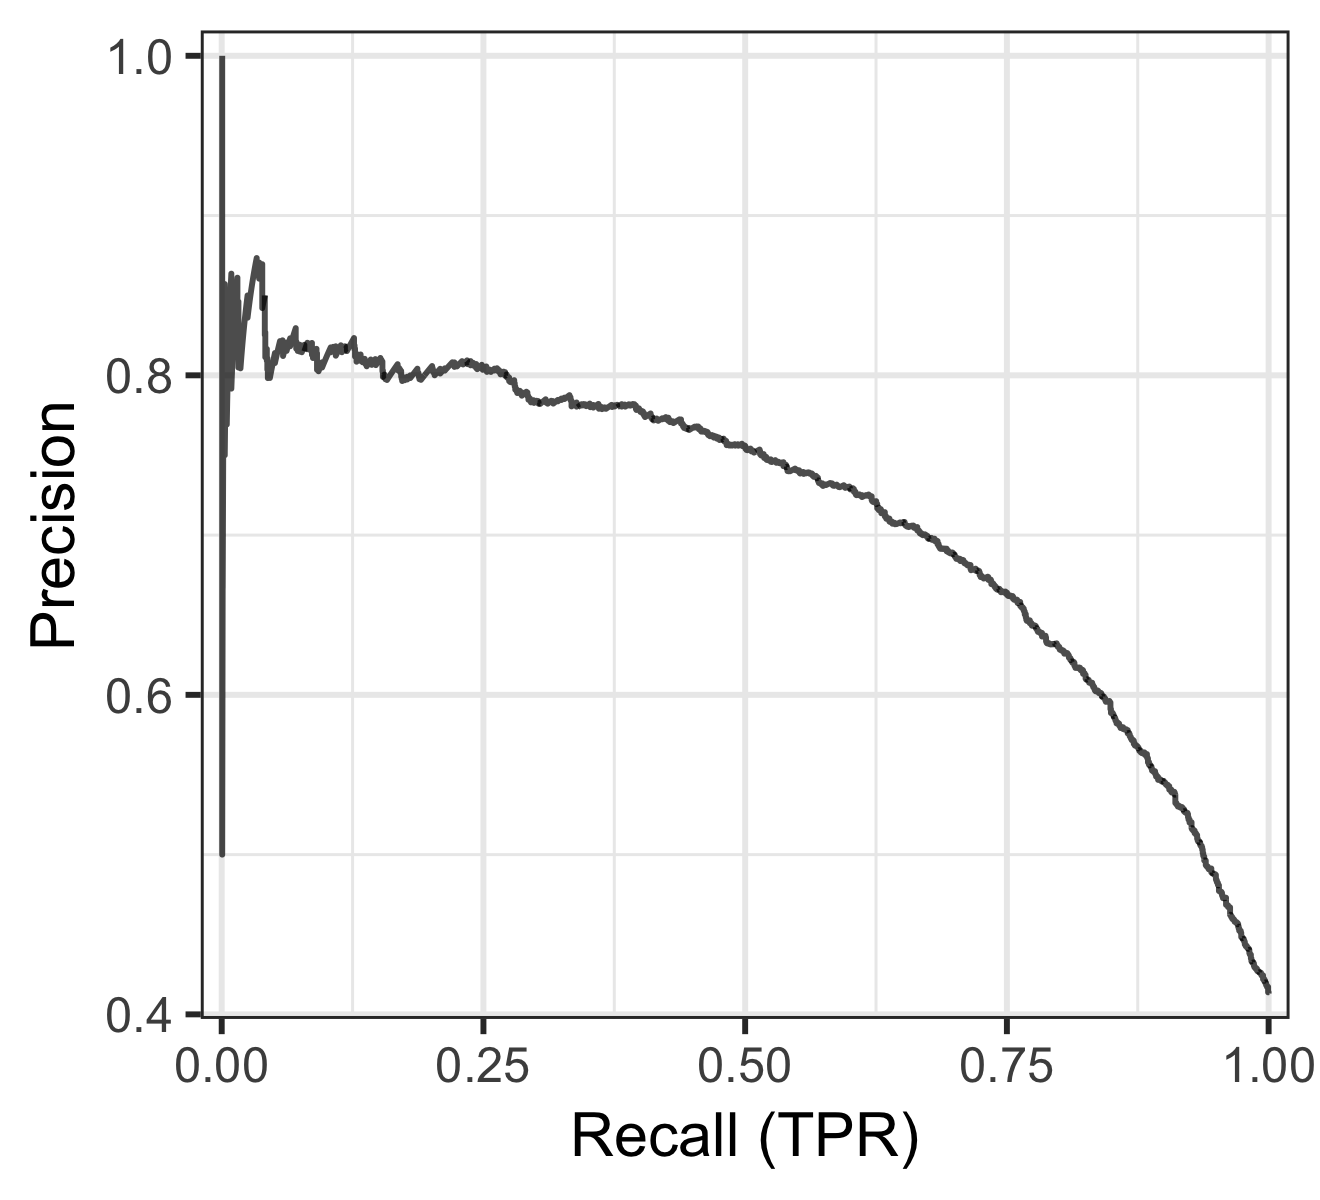
precision vs recall curve
another curve
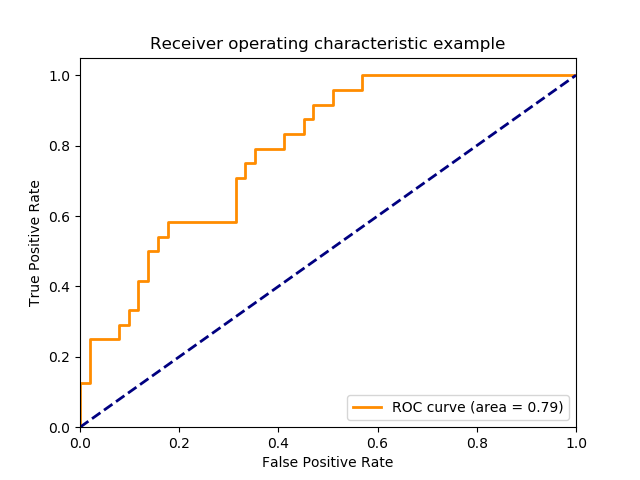
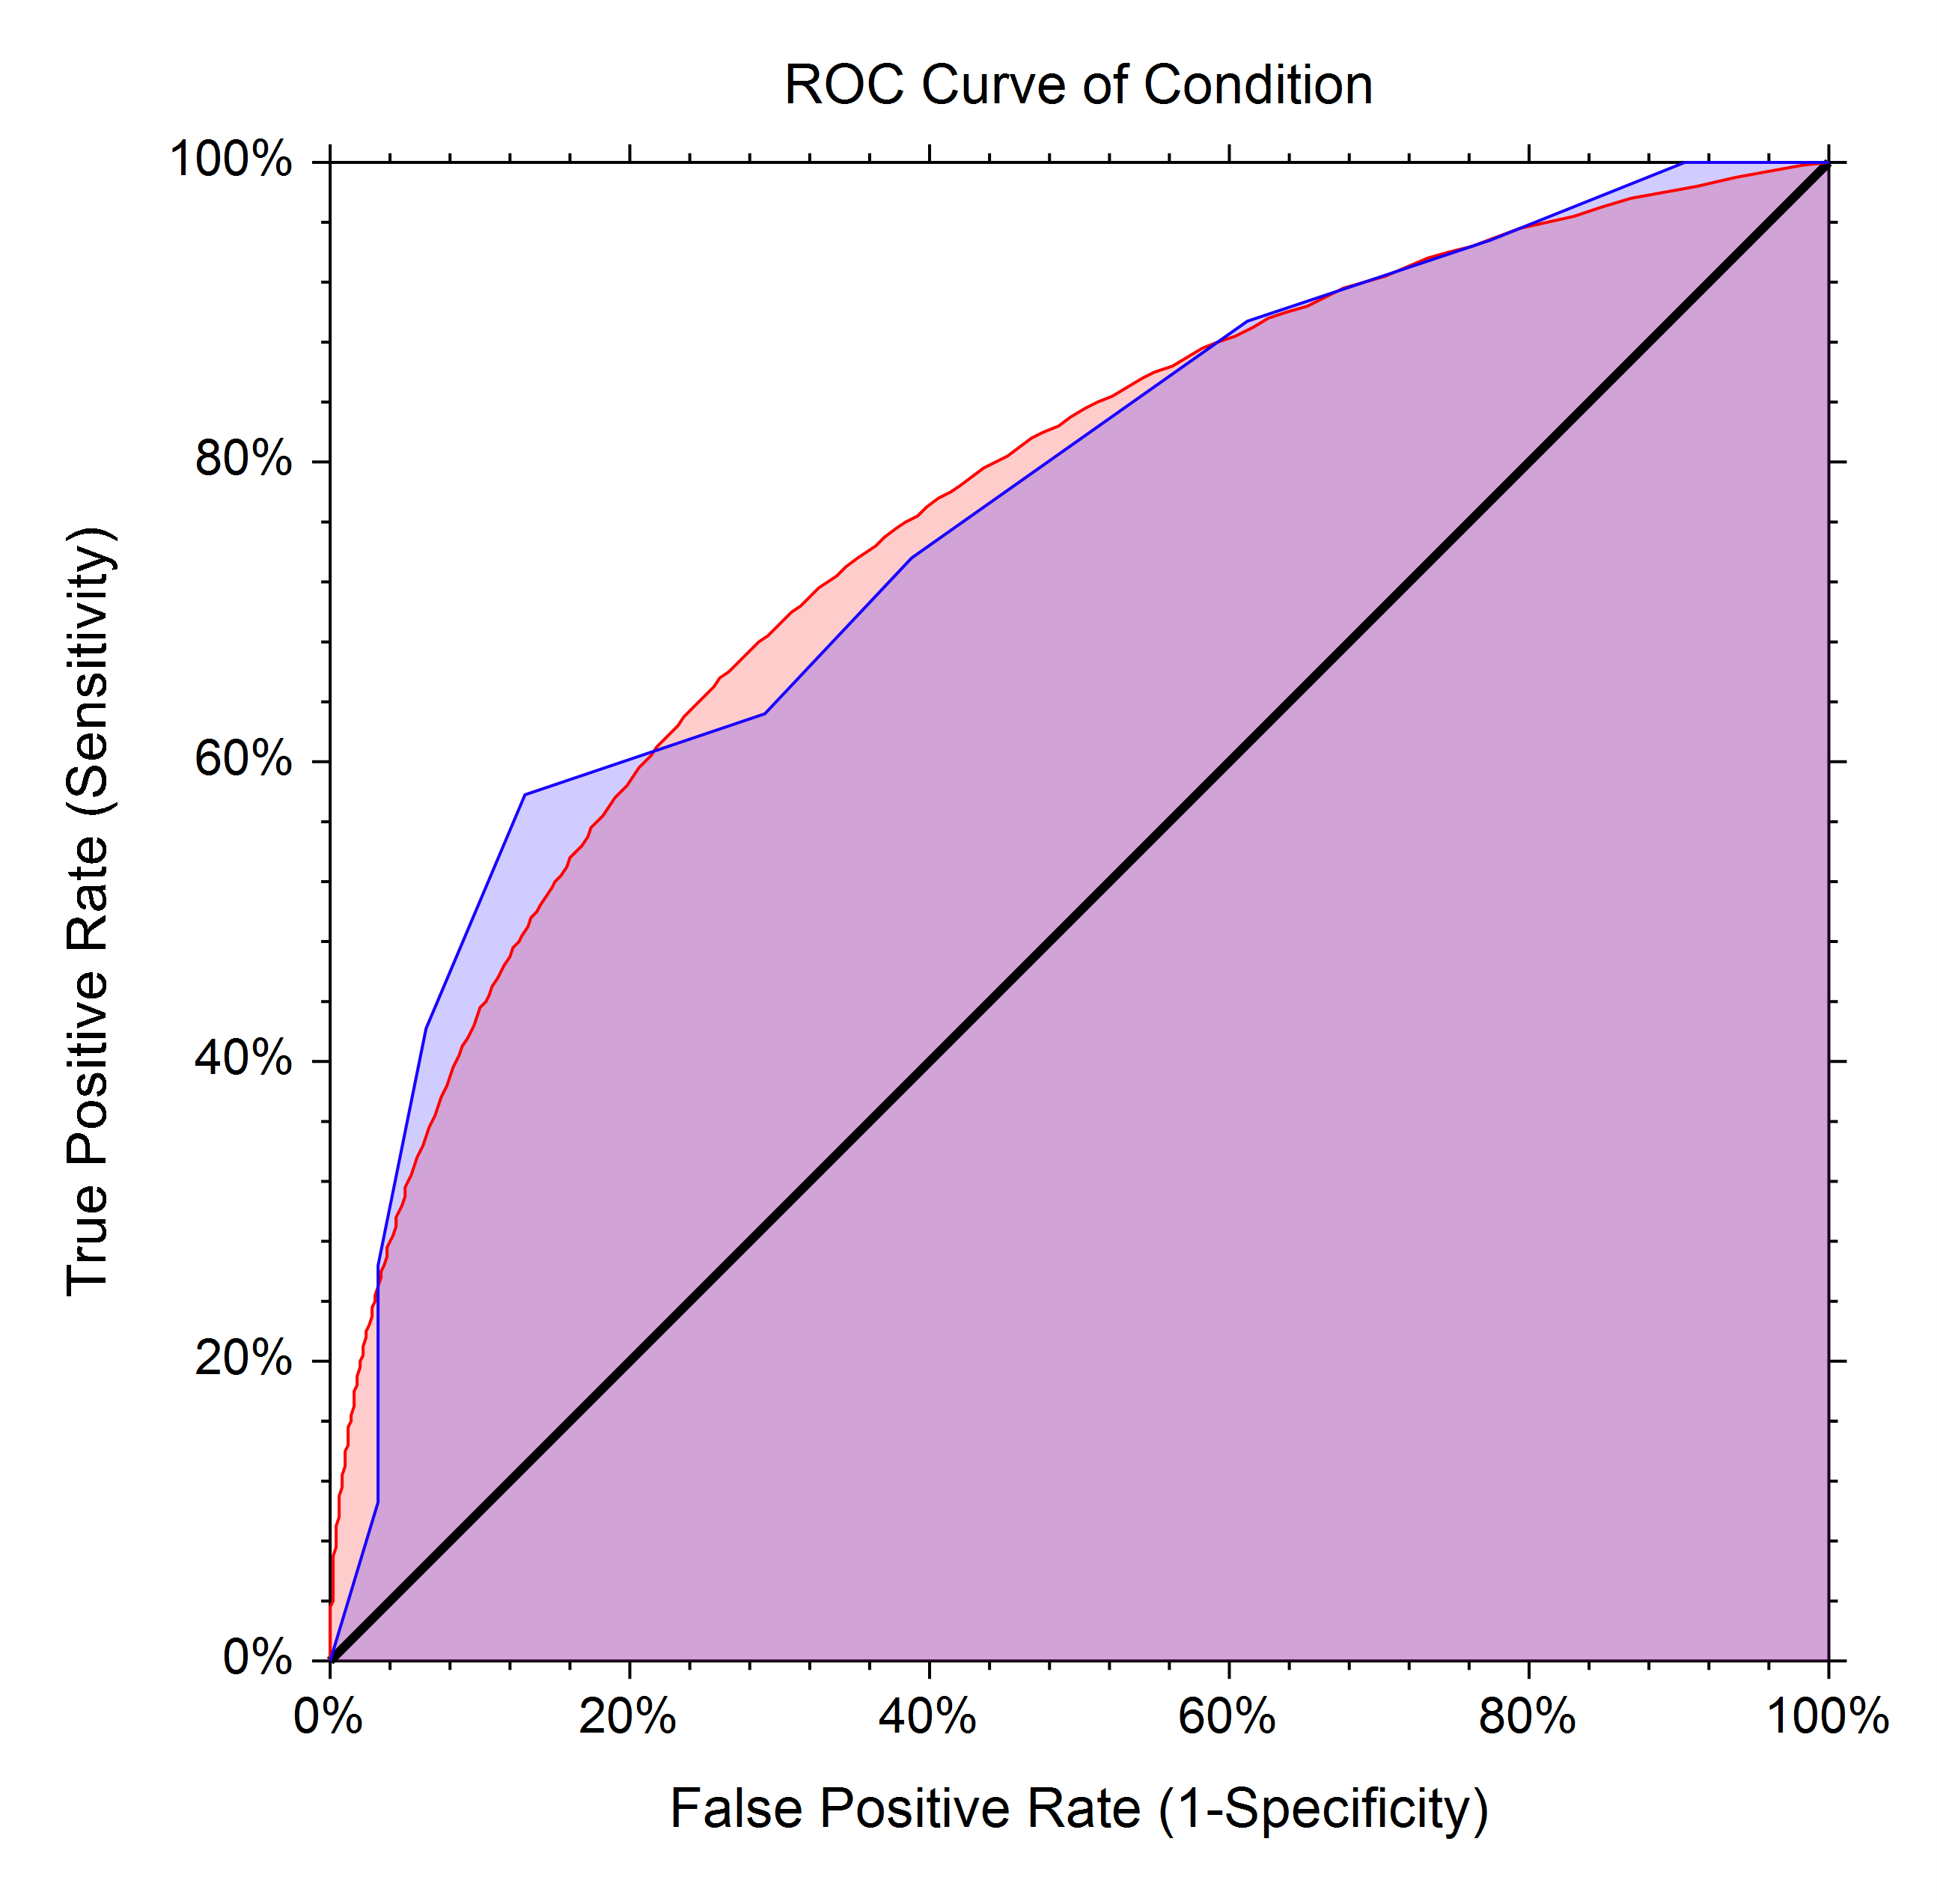
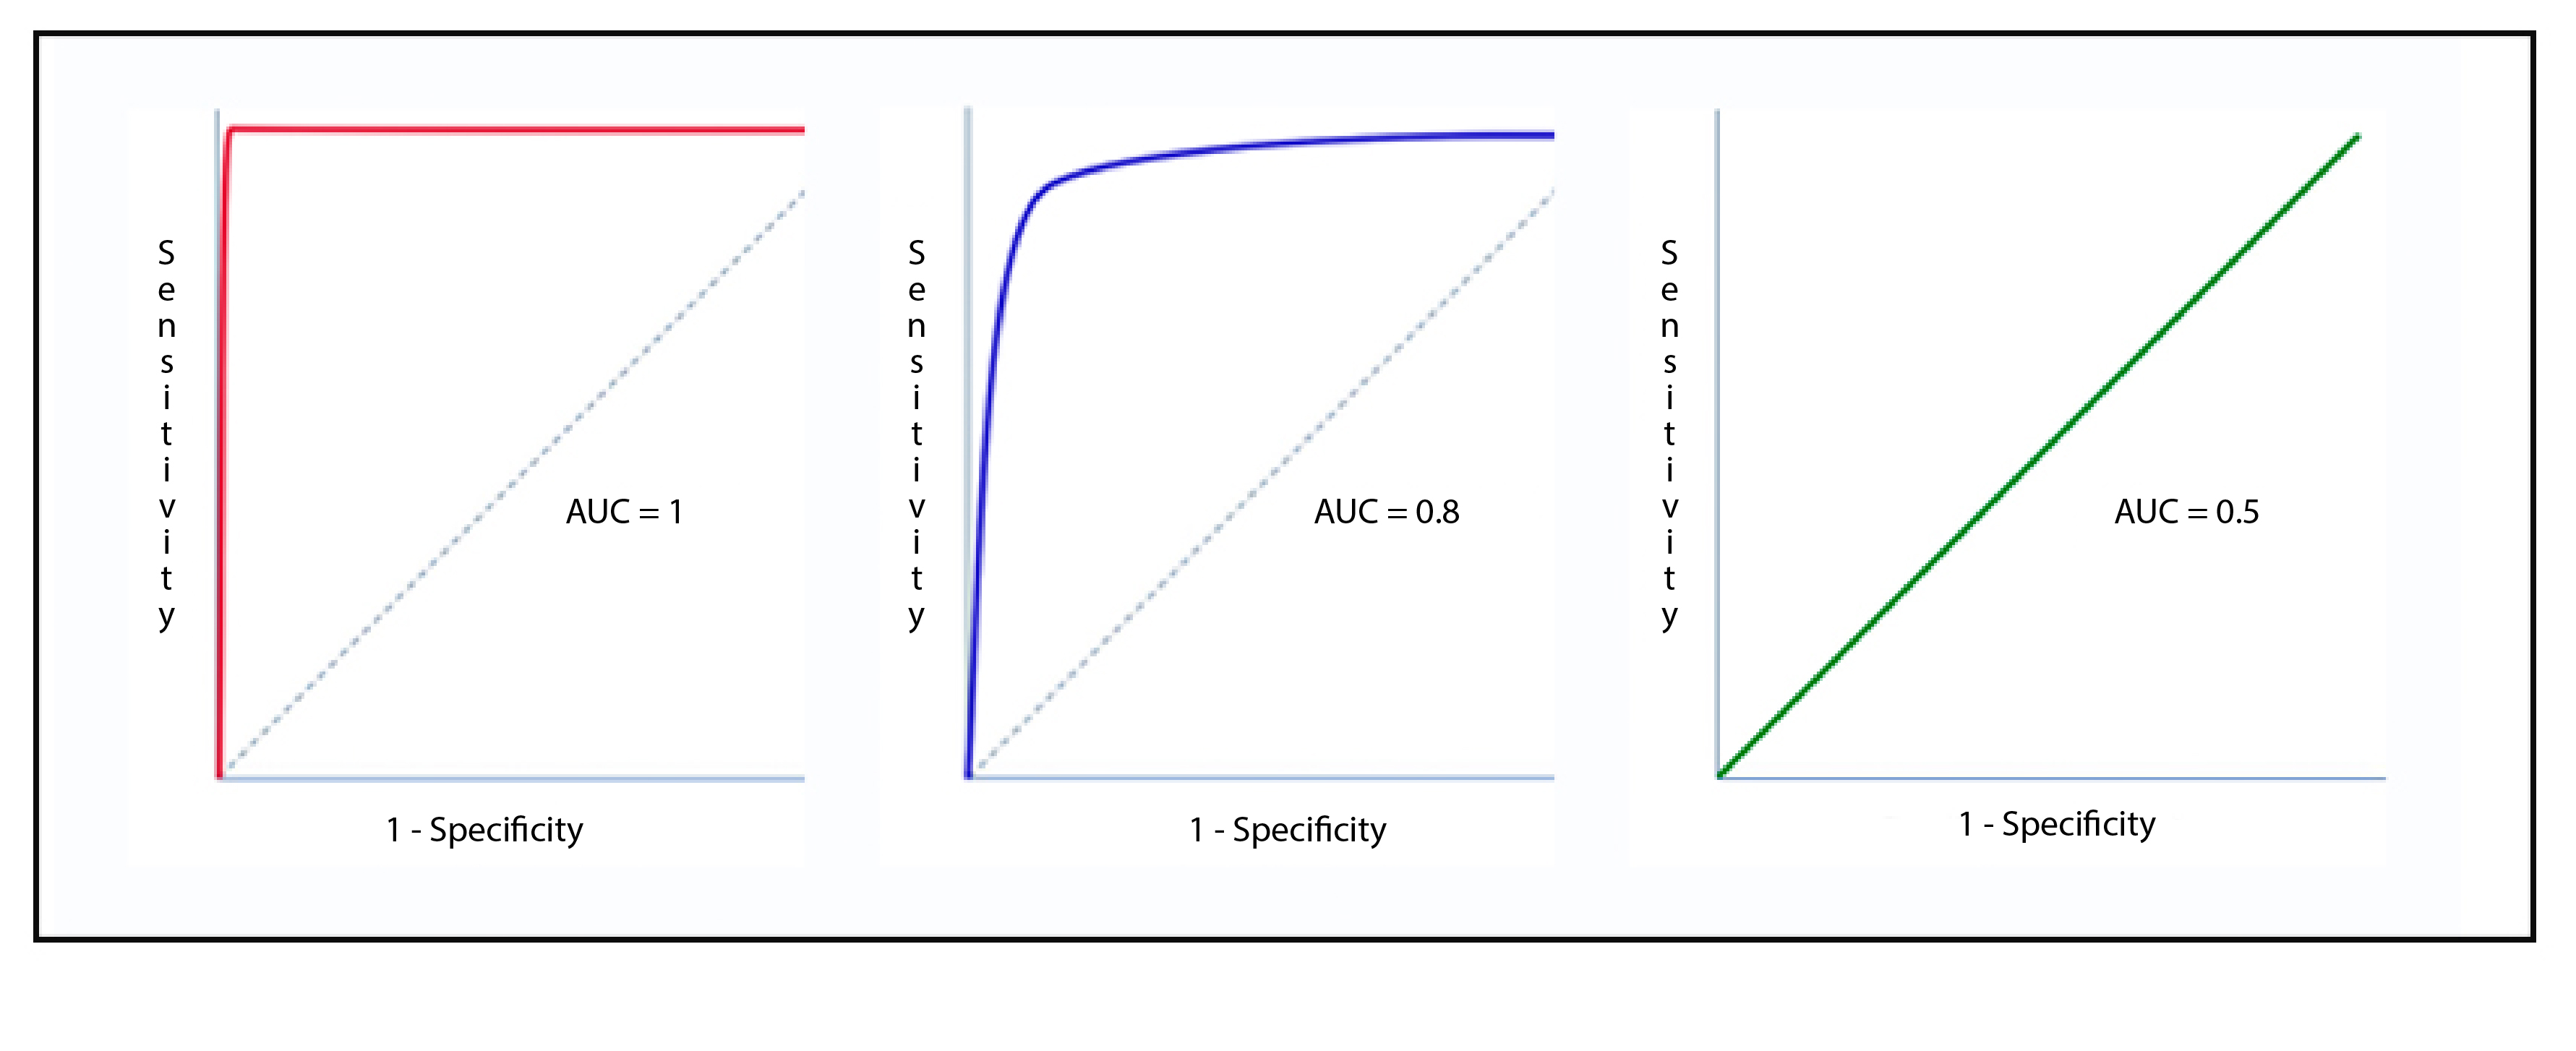
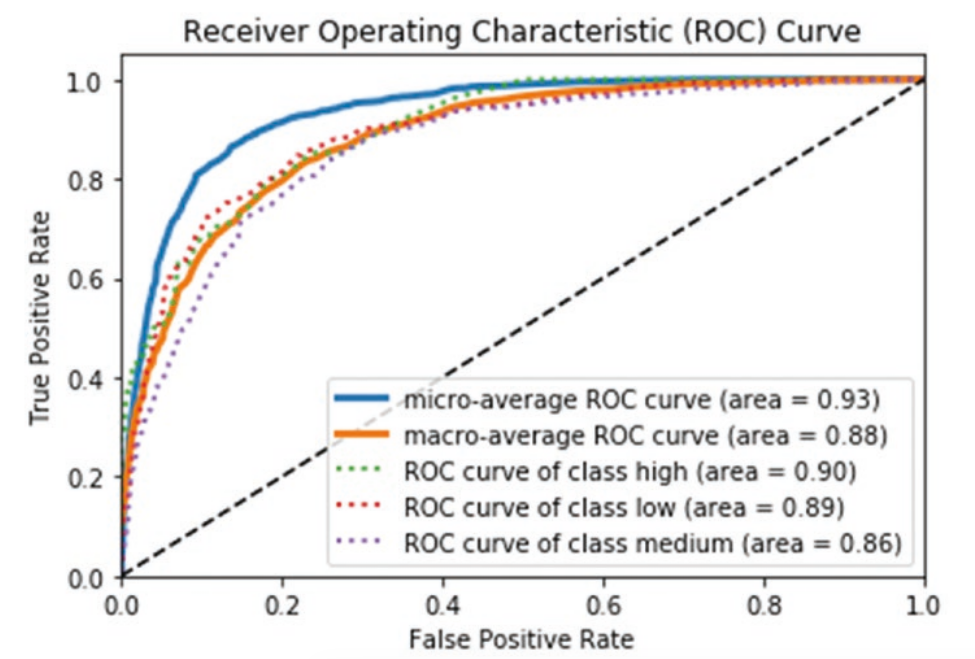
- roc: receiver operating characteristic 接受者操作特征. TPR vs FPR curve
- auc: area under curve. value range (0-1), the bigger, the better.
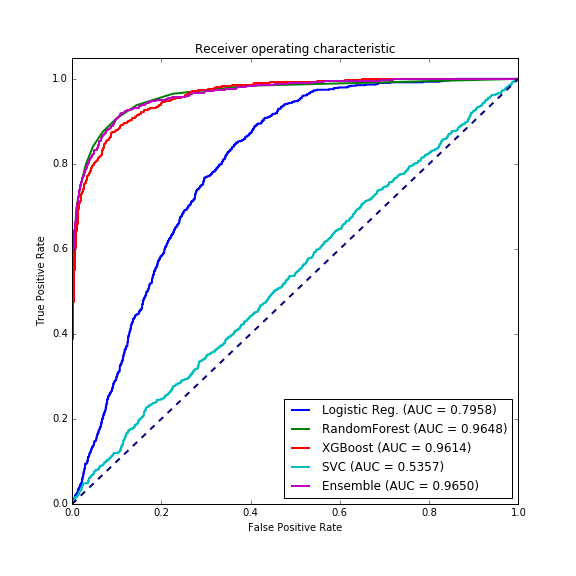
all in one
multi-class classification for ROC
- micro-averaging: treat as binary
- macro-averaging: equal weight
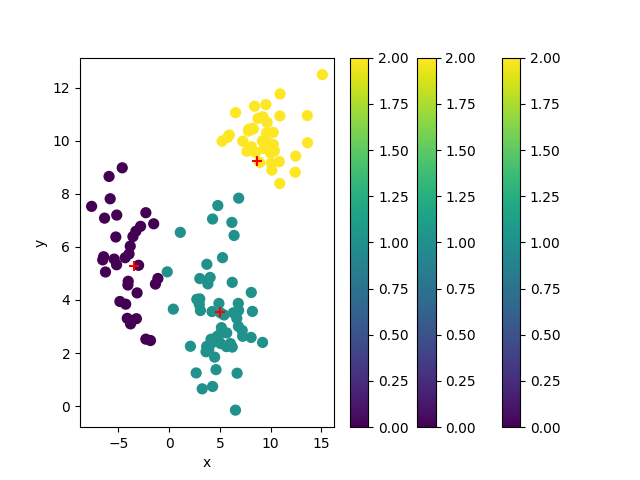
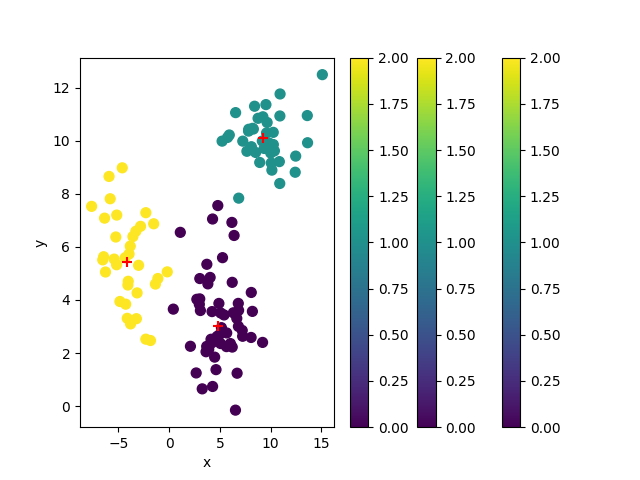
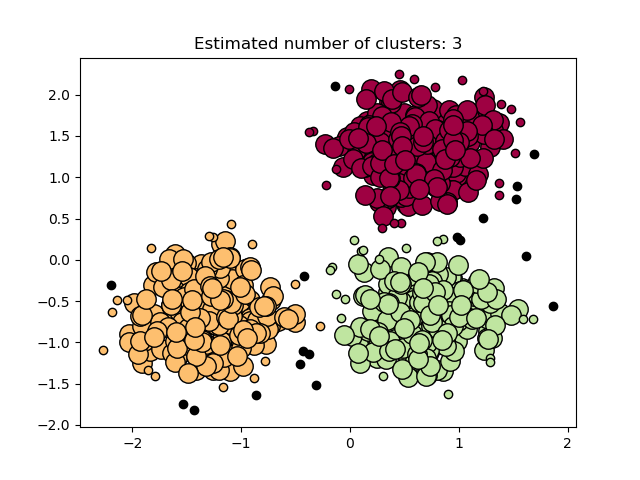
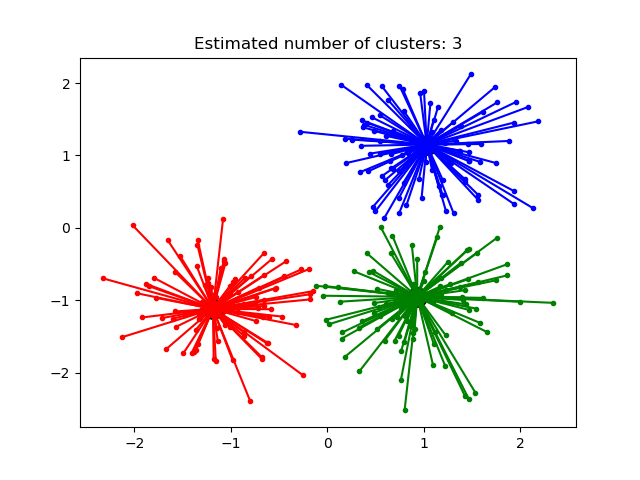
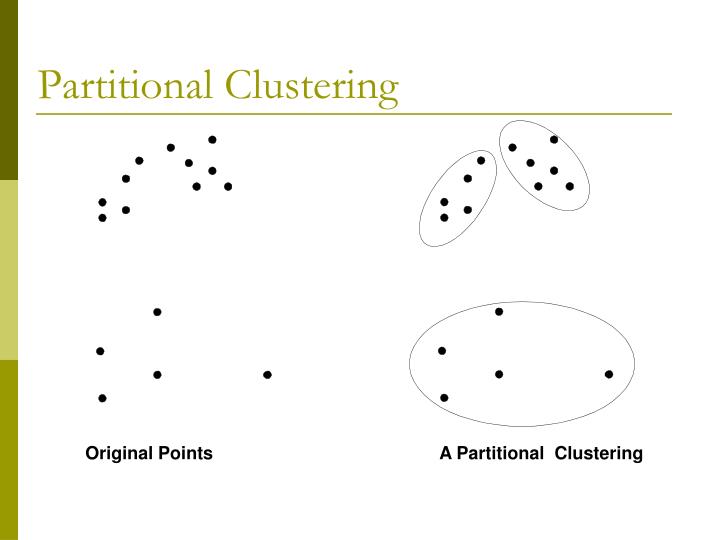
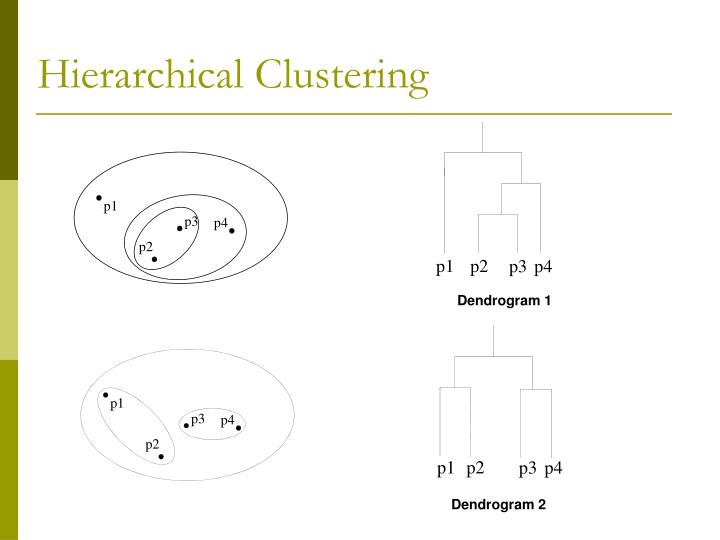
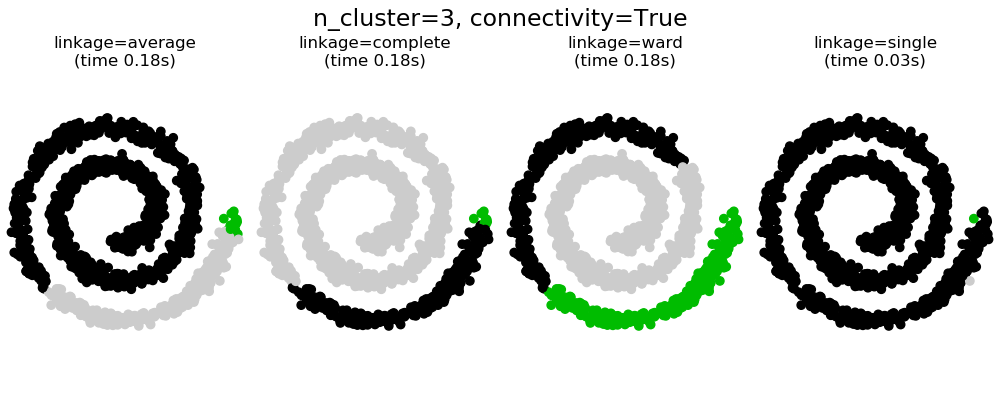
Clustering
types
- partition/centroid based clustering: k-means,k-medoids
- hierachical clustering: AgglomerativeClustering, affinity propagation
- ward/single linkage
- averate linkage
- complete linkage
- distribution based clustering: gaussian mixture models
- densitity based clustering: DBSCAN, OPTICS
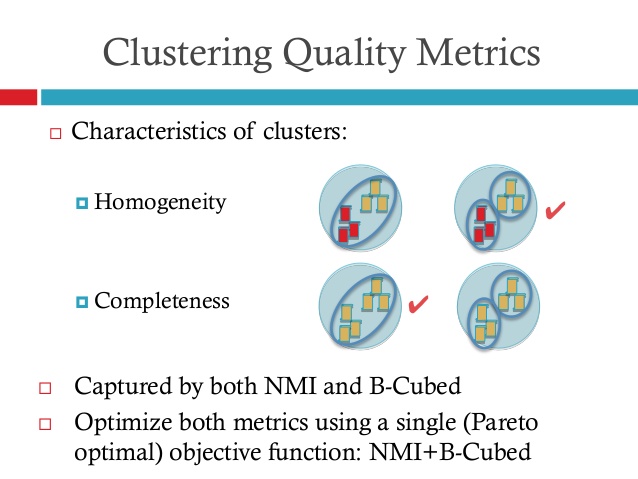
external validation
with labels
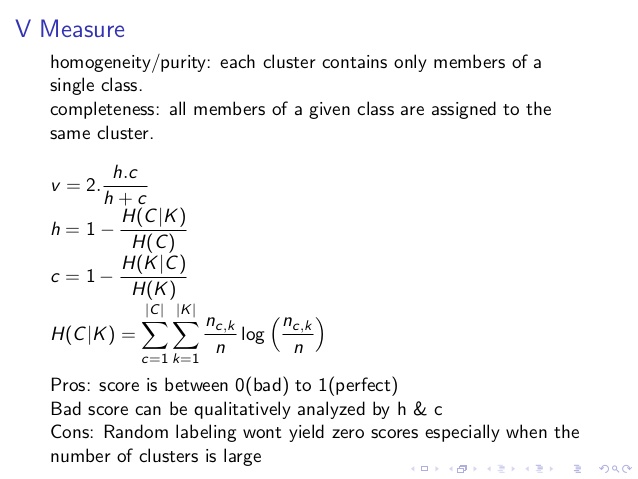
- homogeneity
- completeness
- v-measure: harmonic mean 调和平均值
value range (0-1), the bigger, the better.
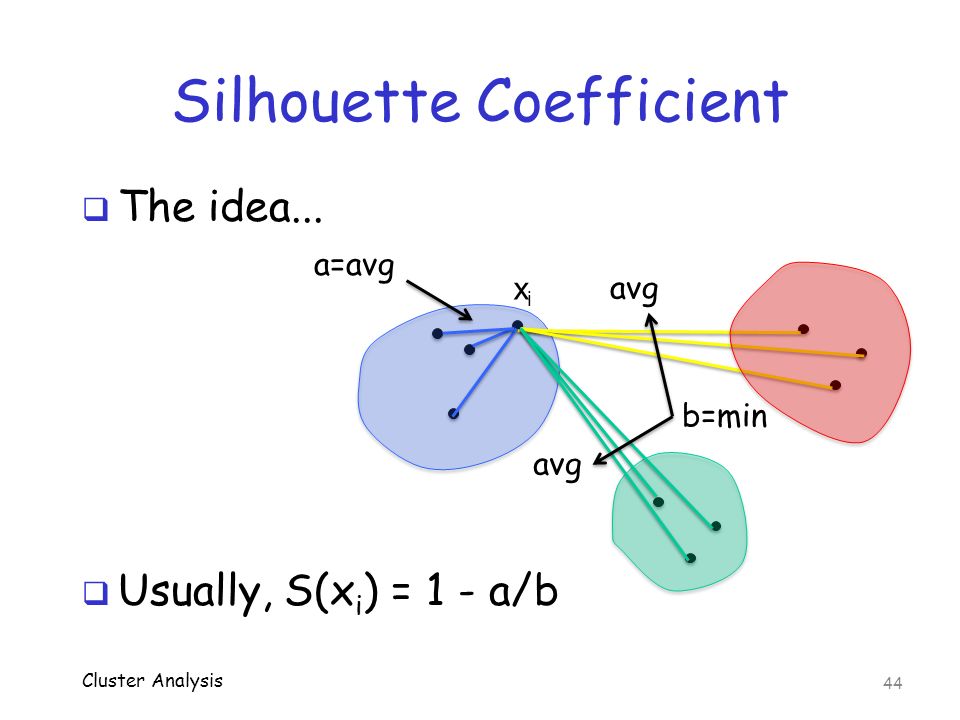
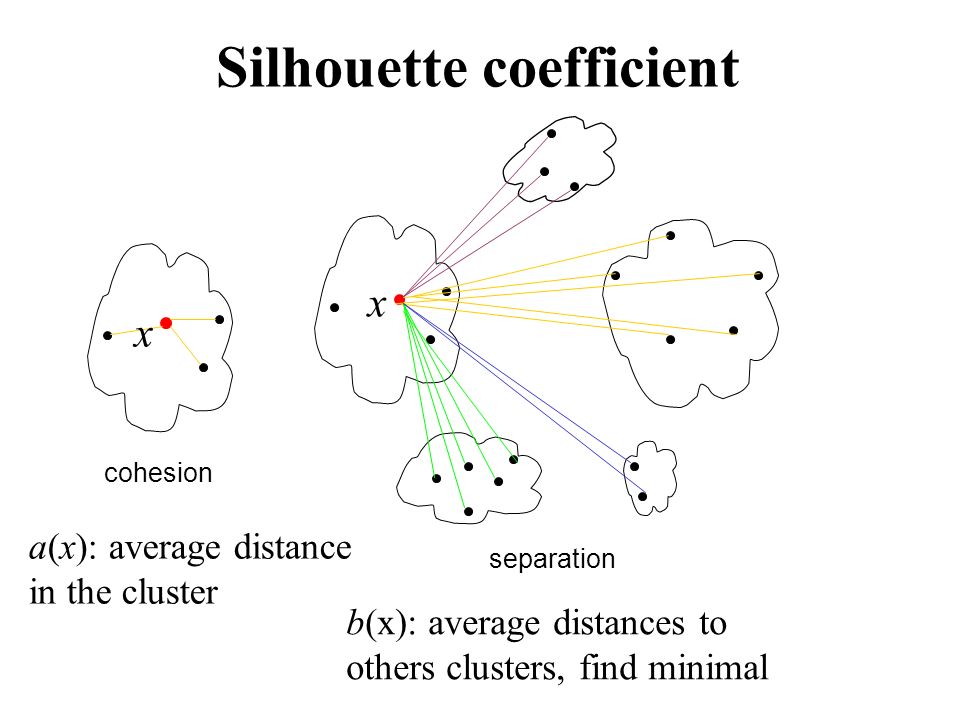
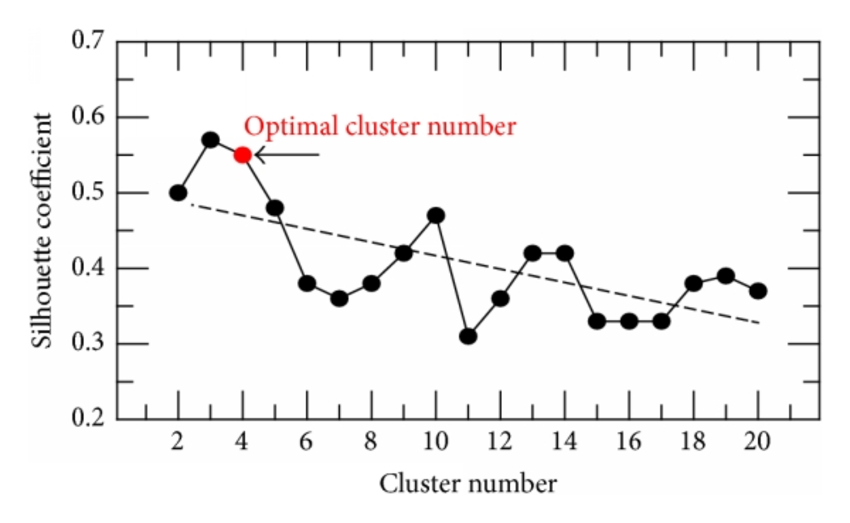
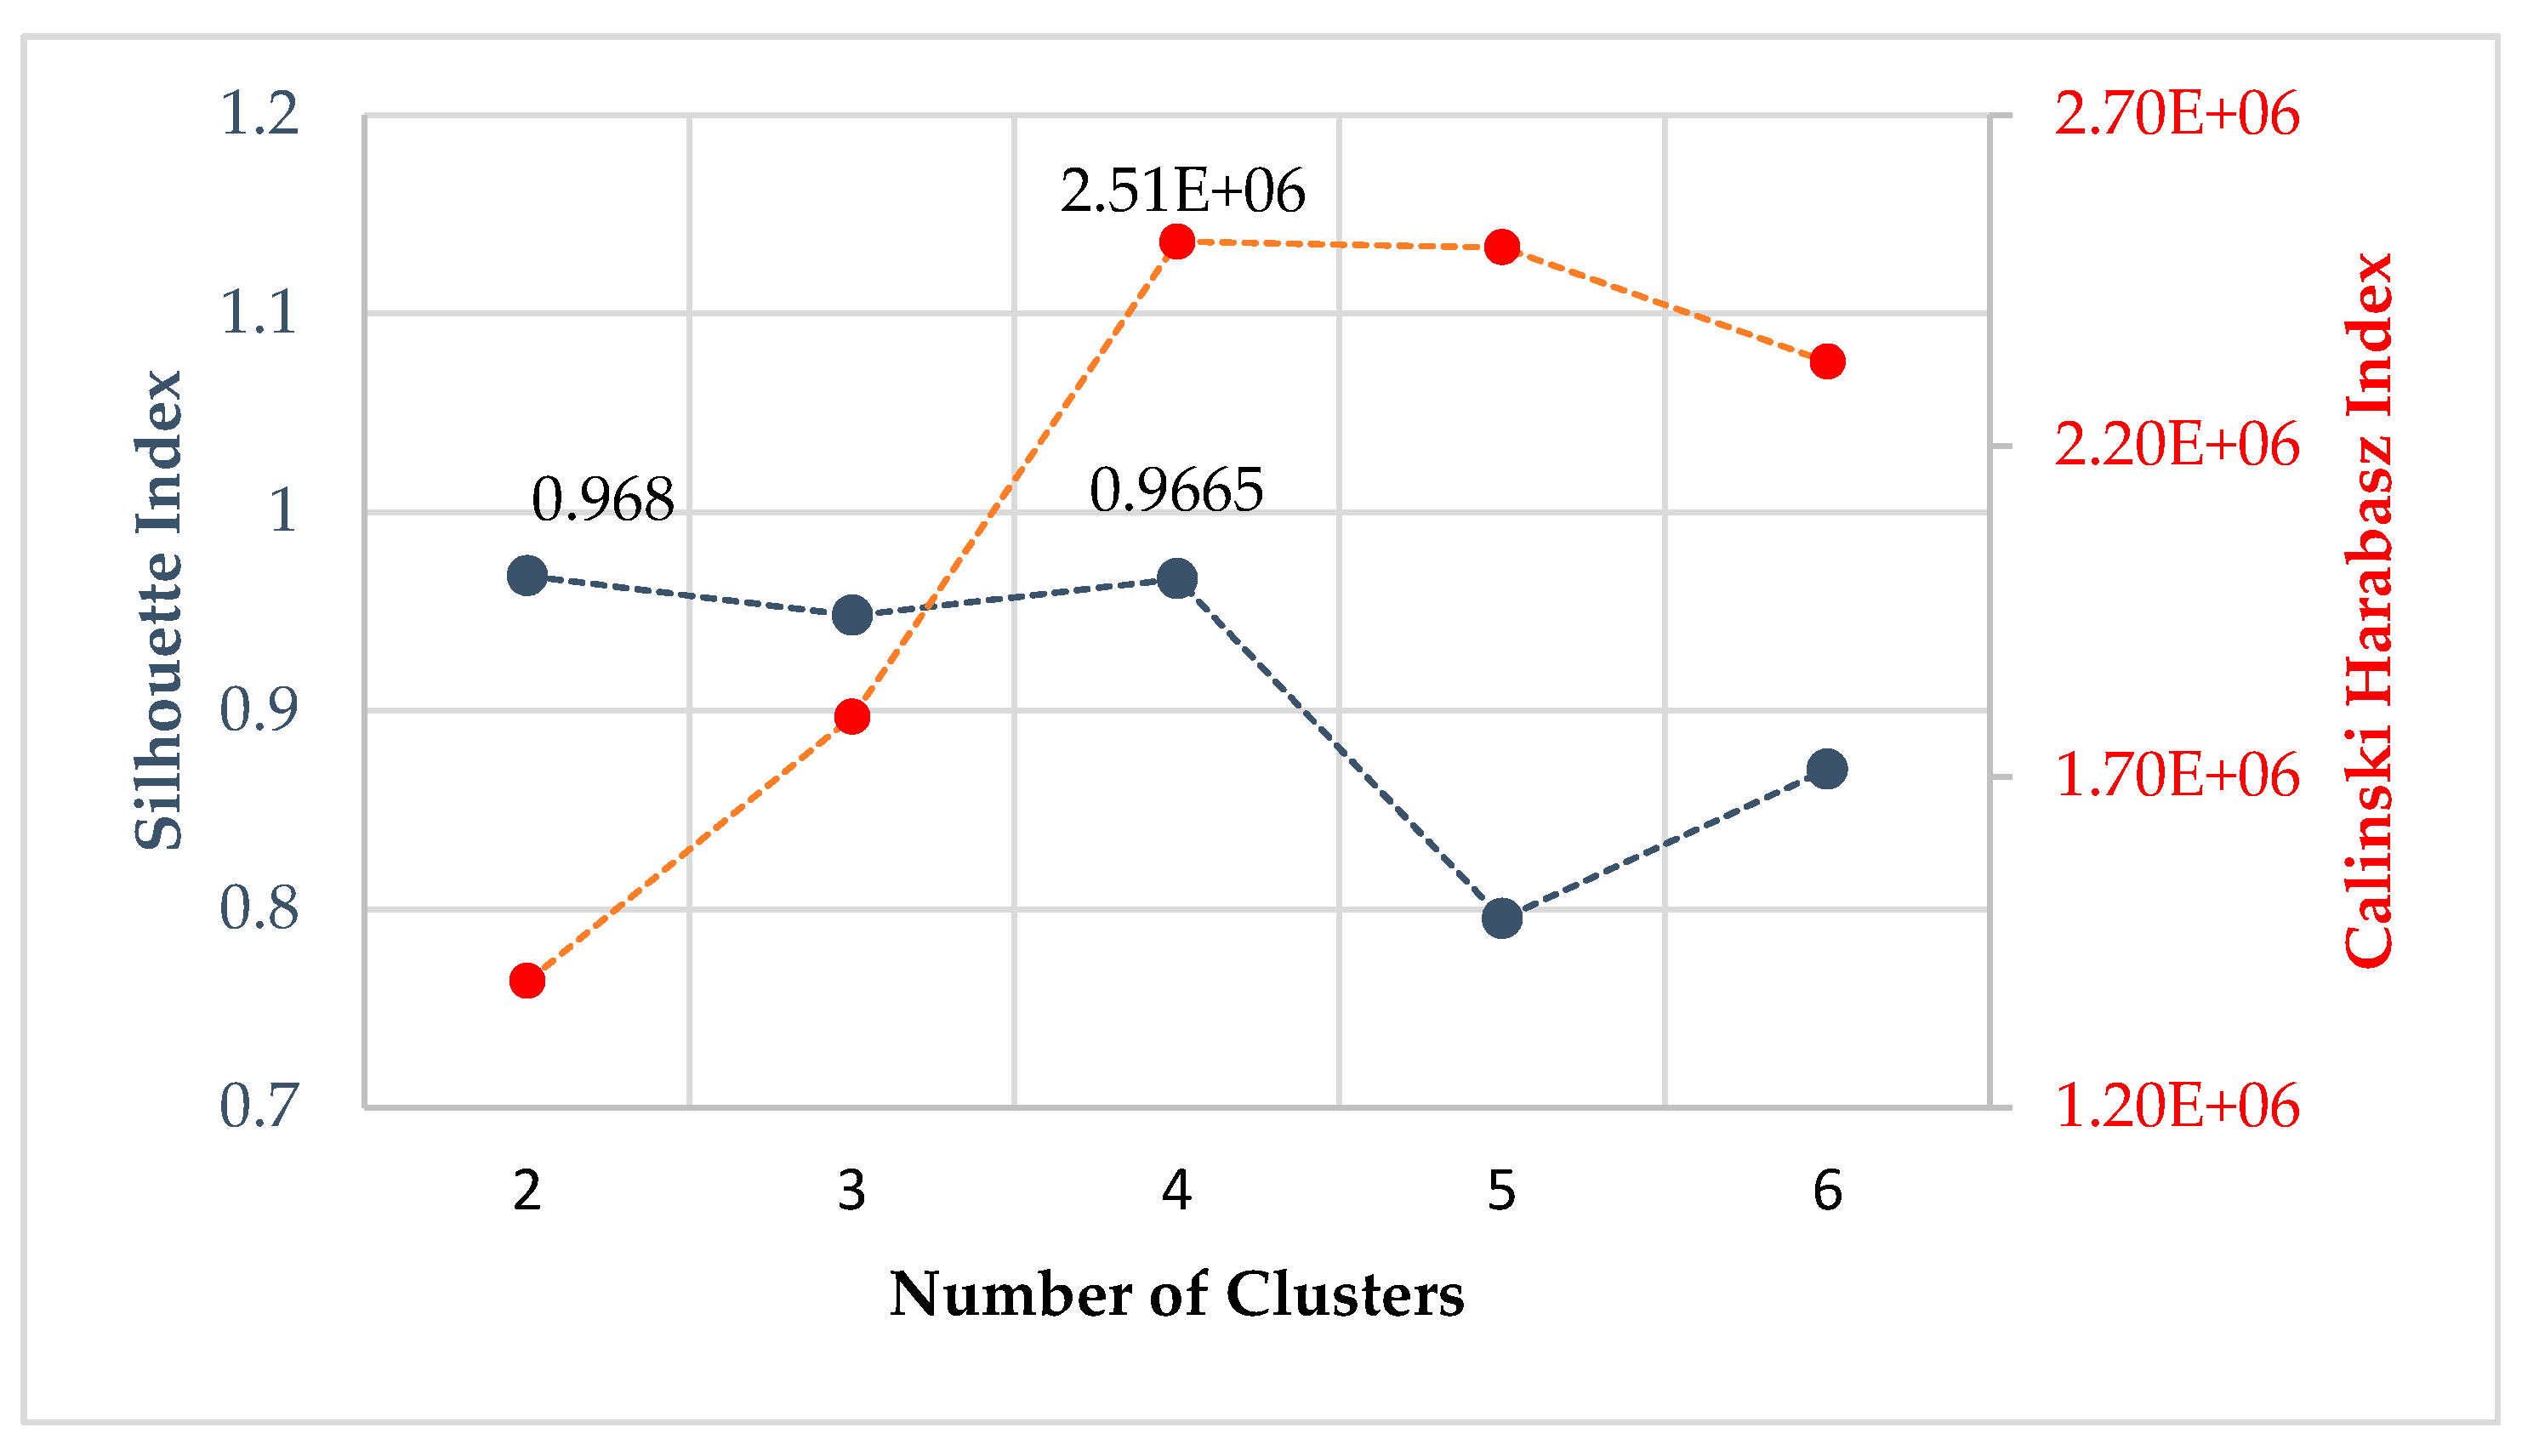
internal validation
no labels
2 most important traits:
- compact groups
- well seperated groups
metric
- silhouette coefficient: SC轮廓系数. value range (-1-1), the bigger, the better.
- calinski-harabaz index: chi指数 value range >0 , the bigger, the better.
Regression
metric:
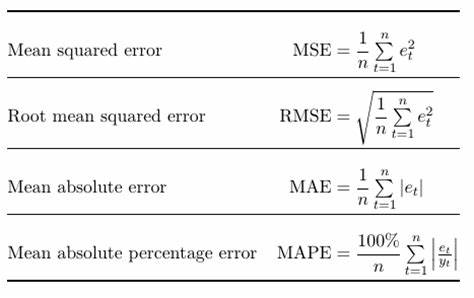
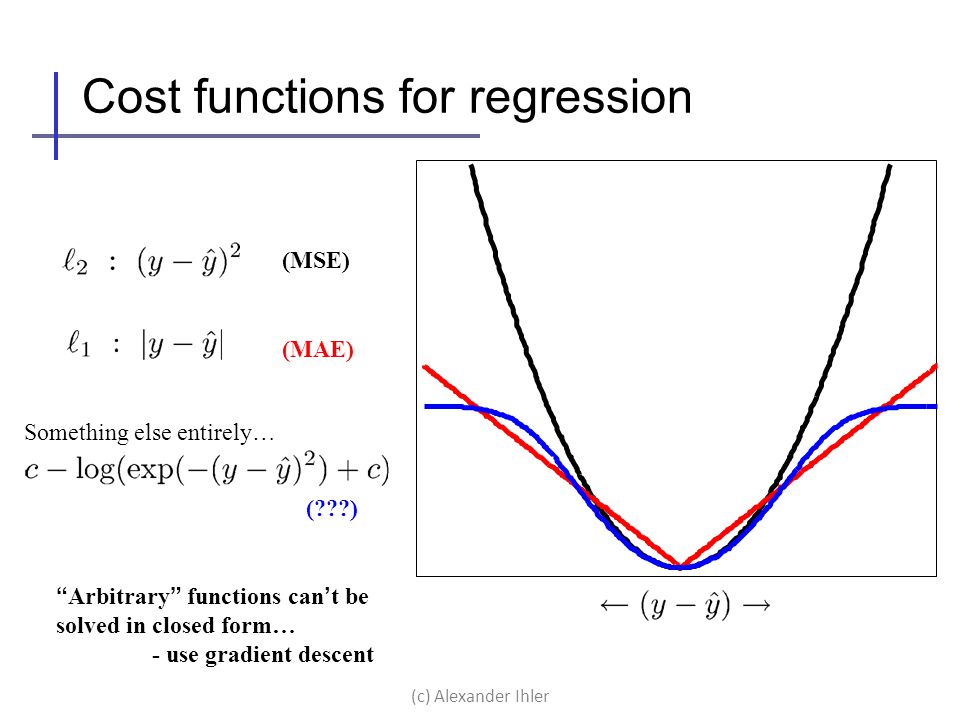
- mean squared error: MSE
- root mean squared error: RMSE
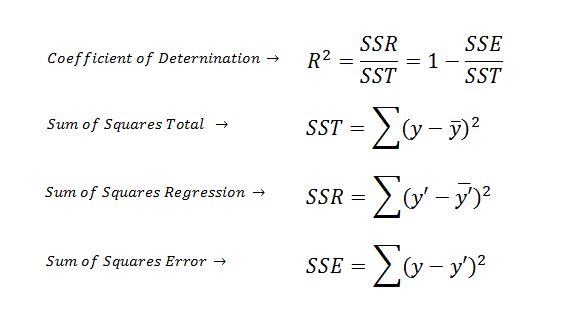
- coefficient of determination (R^2):判定系数
- coefficient of correlation (r):相关系数 value range (-1,1)
R2: value range (0,1), the bigger, the better.
for simple linear regression, R^2 = r^2
formula:
correlation coefficient
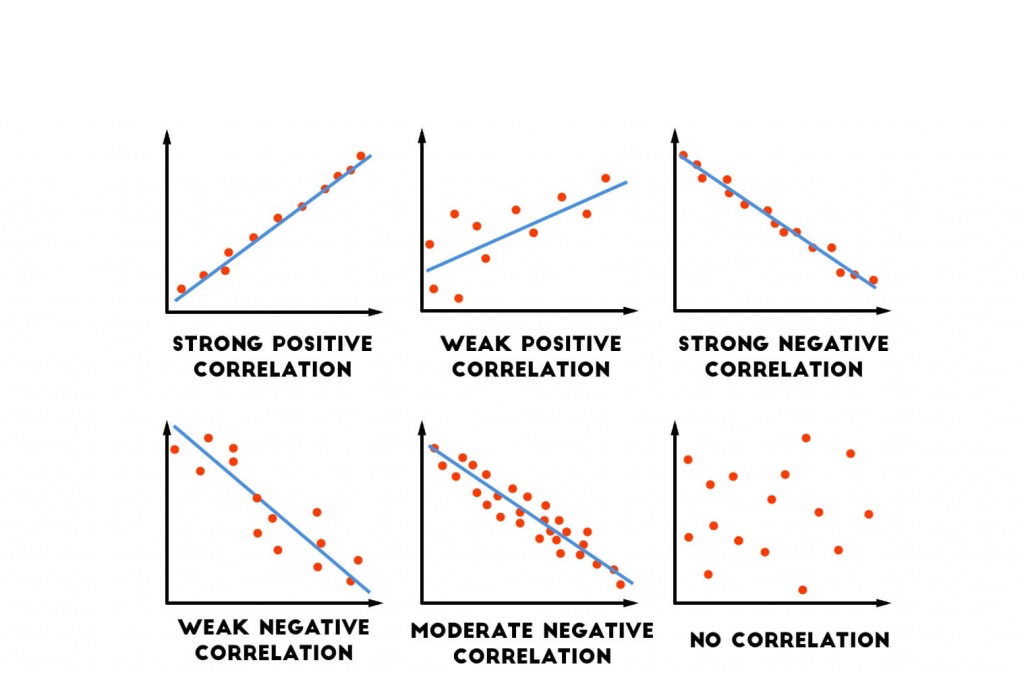
r2 demo
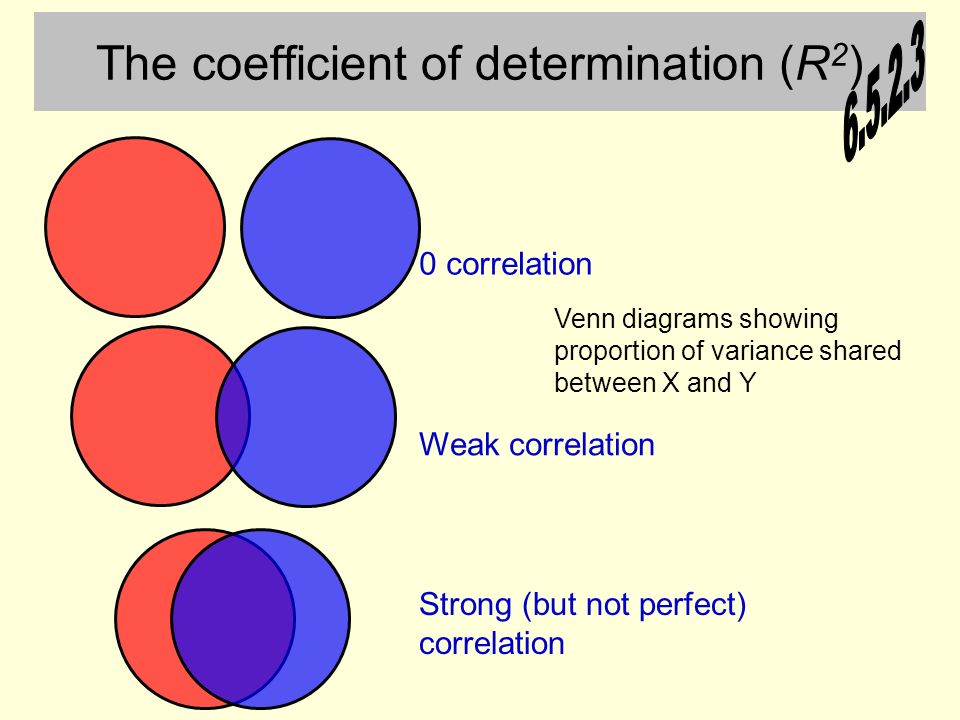
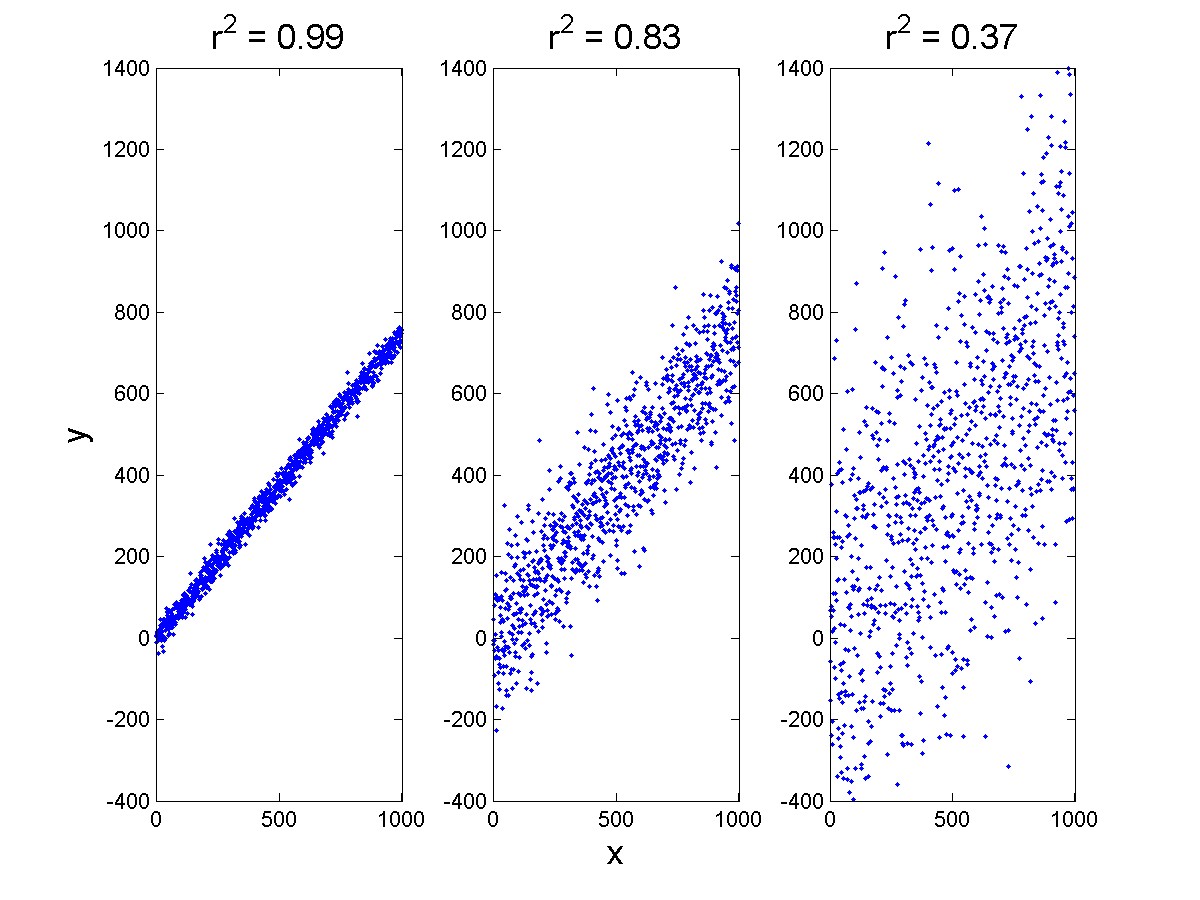
images from bing search.
regression analysis
types
- simple linear regression
- multiple linear regression
- nonlinear regression
assumptions
- training dataset(sample) is representative of the population being modeled
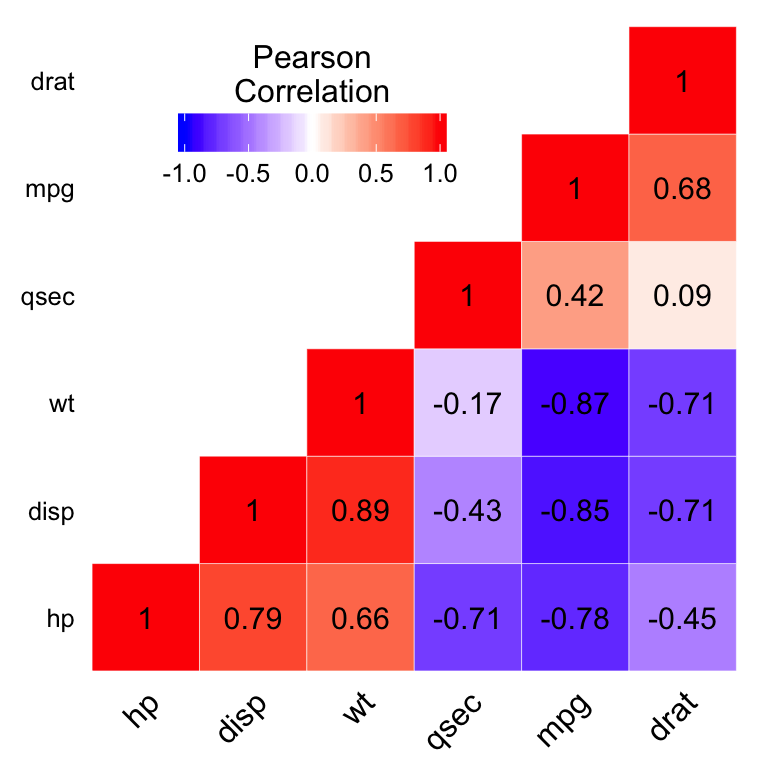
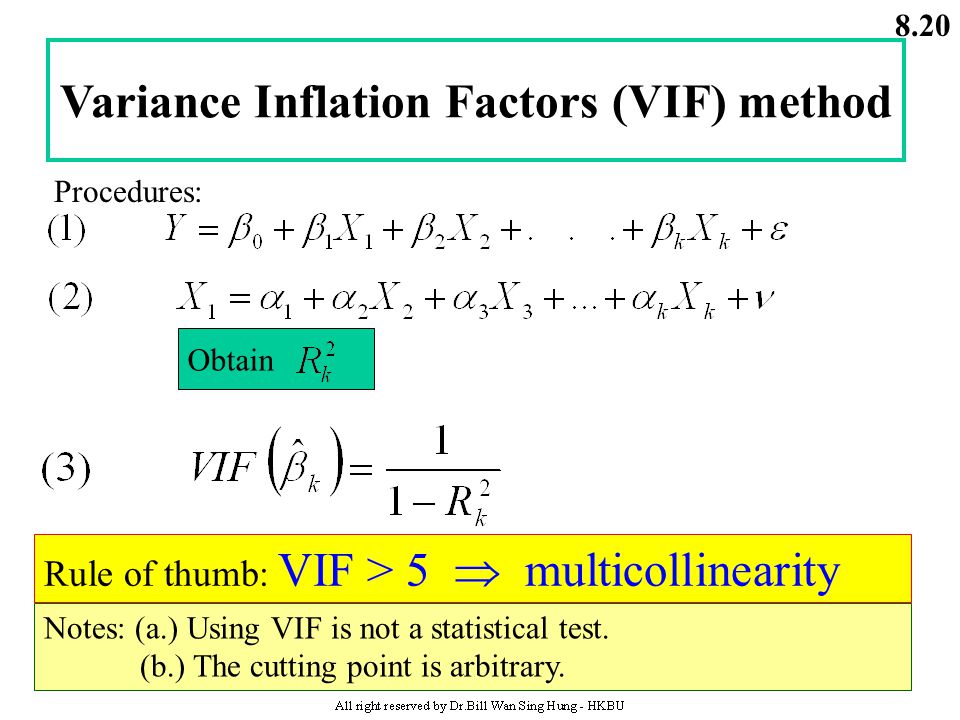
- x1,x2,…,xn are linearly independent. no multicollinearity 非多重共线性
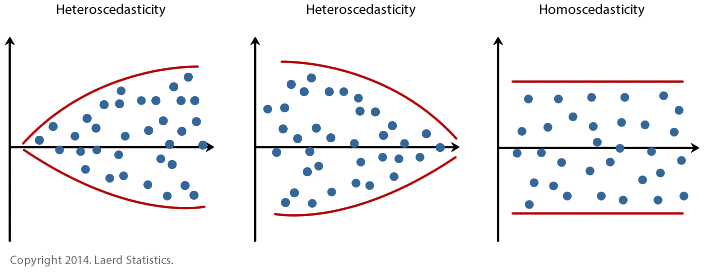
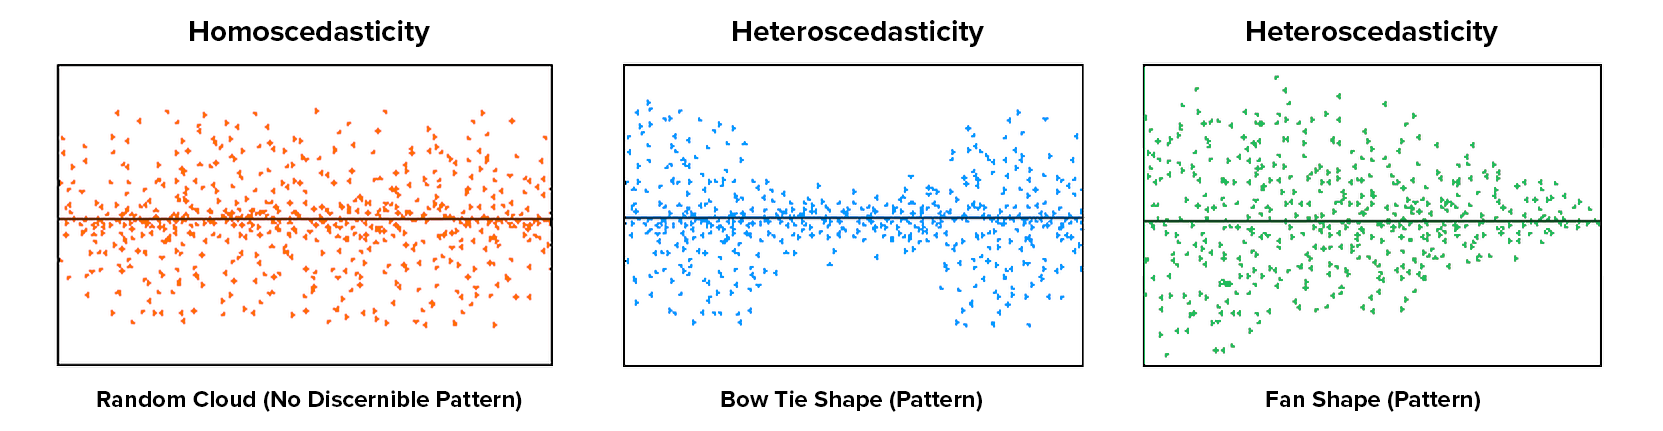
- homoscedasticity of error 同方差性: residuals being random and no any patterns
multicollinearity 多重共线性: correlation matrix
variance inflation factor (VIF)方差膨胀因子 VIFi = 1/(1-Ri^2). VIF越大,显示共线性越严重。经验判断方法表明:当0<VIF<10,不存在多重共线性;当10≤VIF<100,存在较强的多重共线性;当VIF≥100,存在严重多重共线性。
homo-scedastic(同方差) vs hetero-scedastic (异方差性): residual plot
homogeneous vs heterogeneous 同质的vs异质的
evaluation analysis
- residual analysis
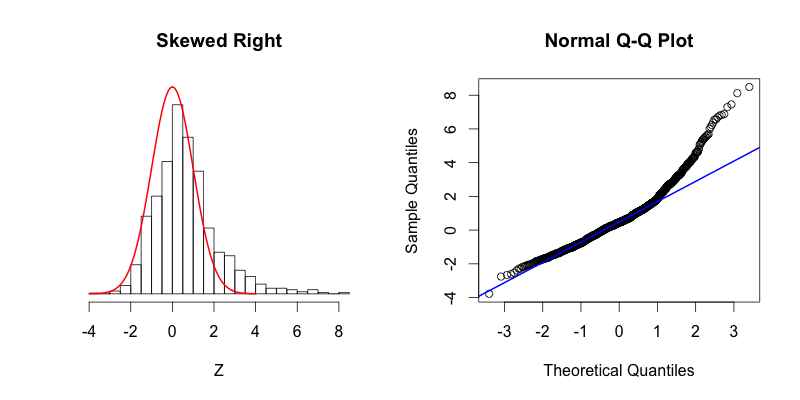
- normality tests (Q-Q plot)正态分布检验
- R^2
linear regression
y = kx + b, use OLS
decision tree based regression
linear vs non-linear regression:
- linear regression
- decision tree based regression (non-linear)
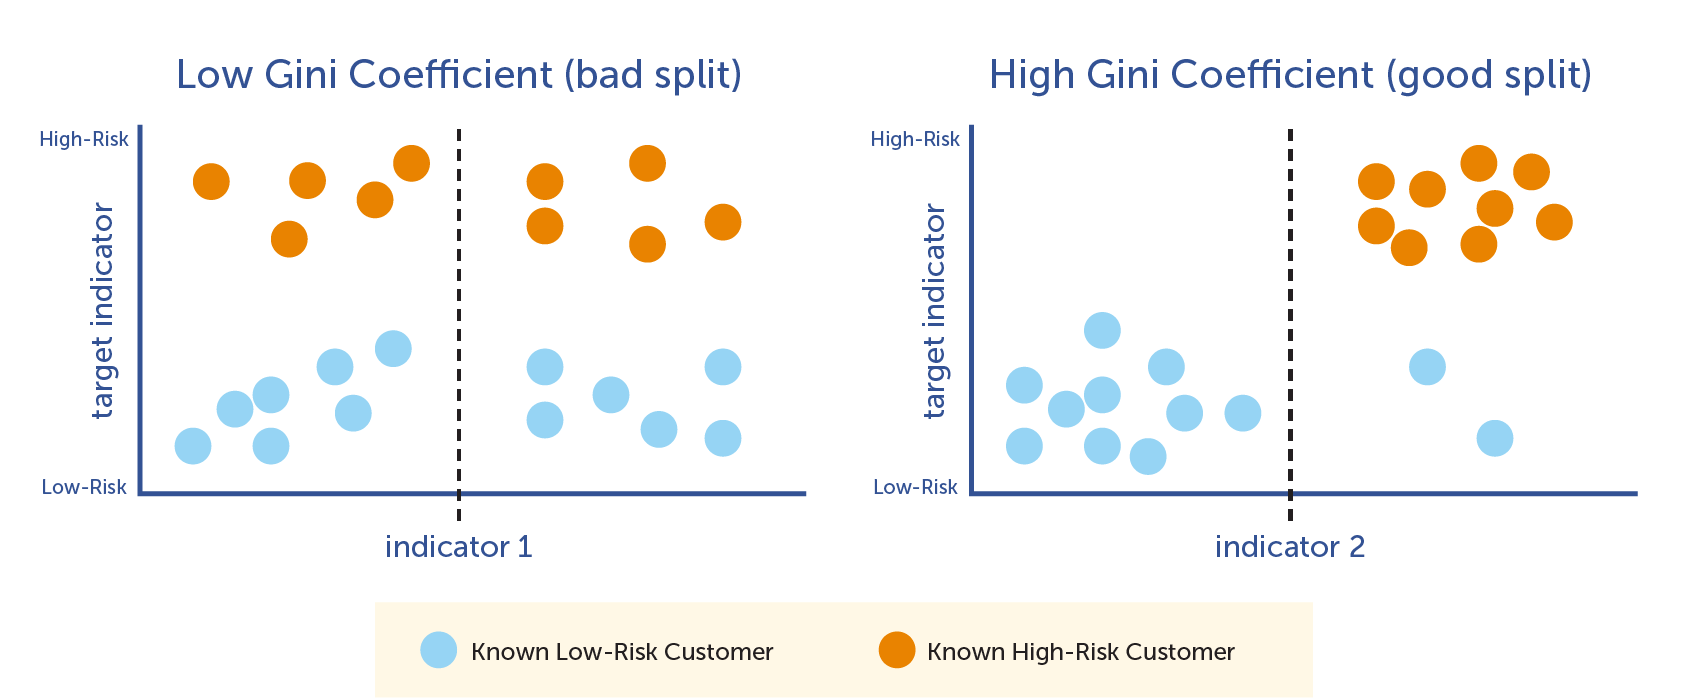
decision tree can be used for both classification and regression. CART
node splitting
for regression:
- MSE: mean squared error
- RMSE: root mean squared error
- MAE: mean absolute error
- MAPE: mean absolute percentage error
for classification
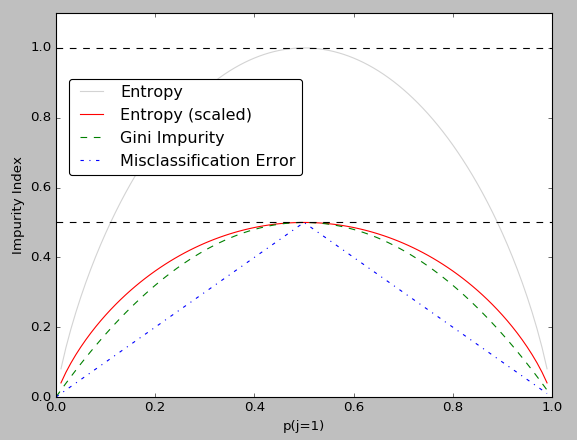
- information gain(entropy): 信息增益(熵)
- gini impurity/index: GINI 基尼不纯度
- misclassification error:
stoppint criteria
- max depth
- min samples to split internal nodes
- max leaf nodes
use GridSearch to search for optimal hyperparameters
decesion tree algorithms
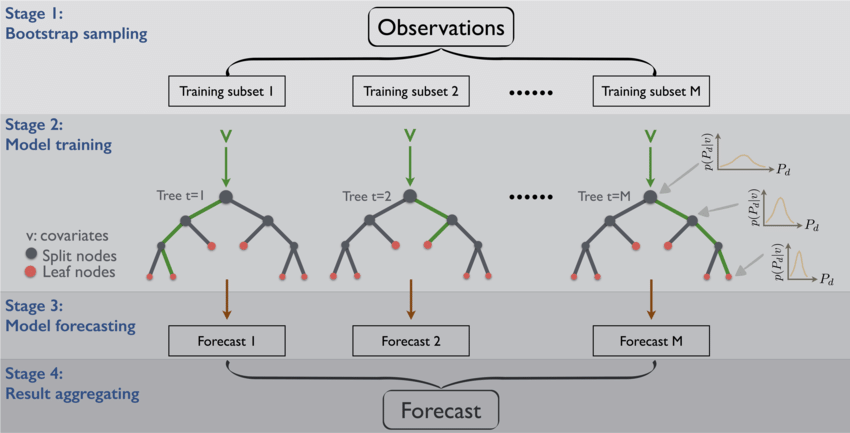
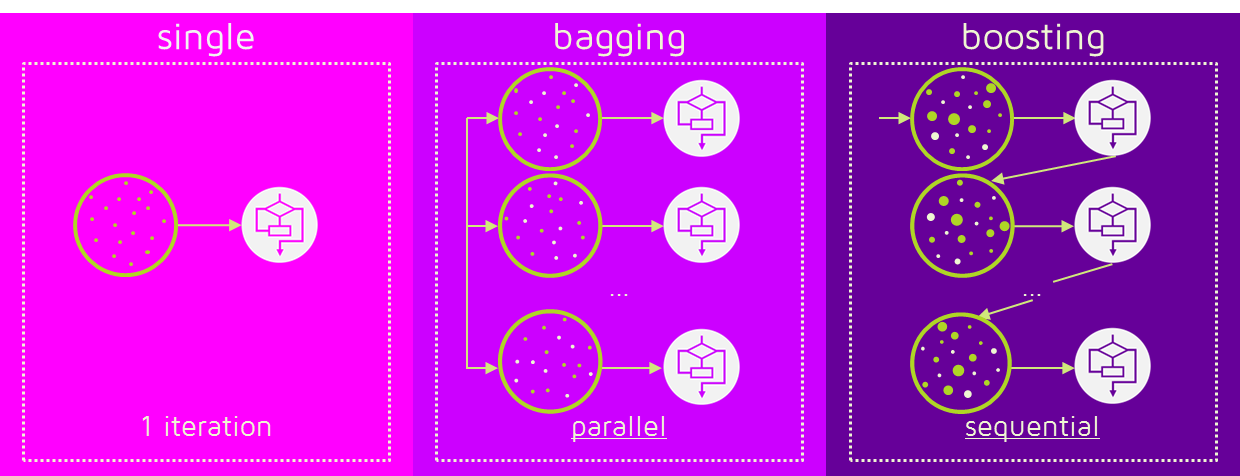
ensemble learning
3 major families:
- bagging: boostrap aggregating, boostrap sampling(自助采样法) eg. RandomForest
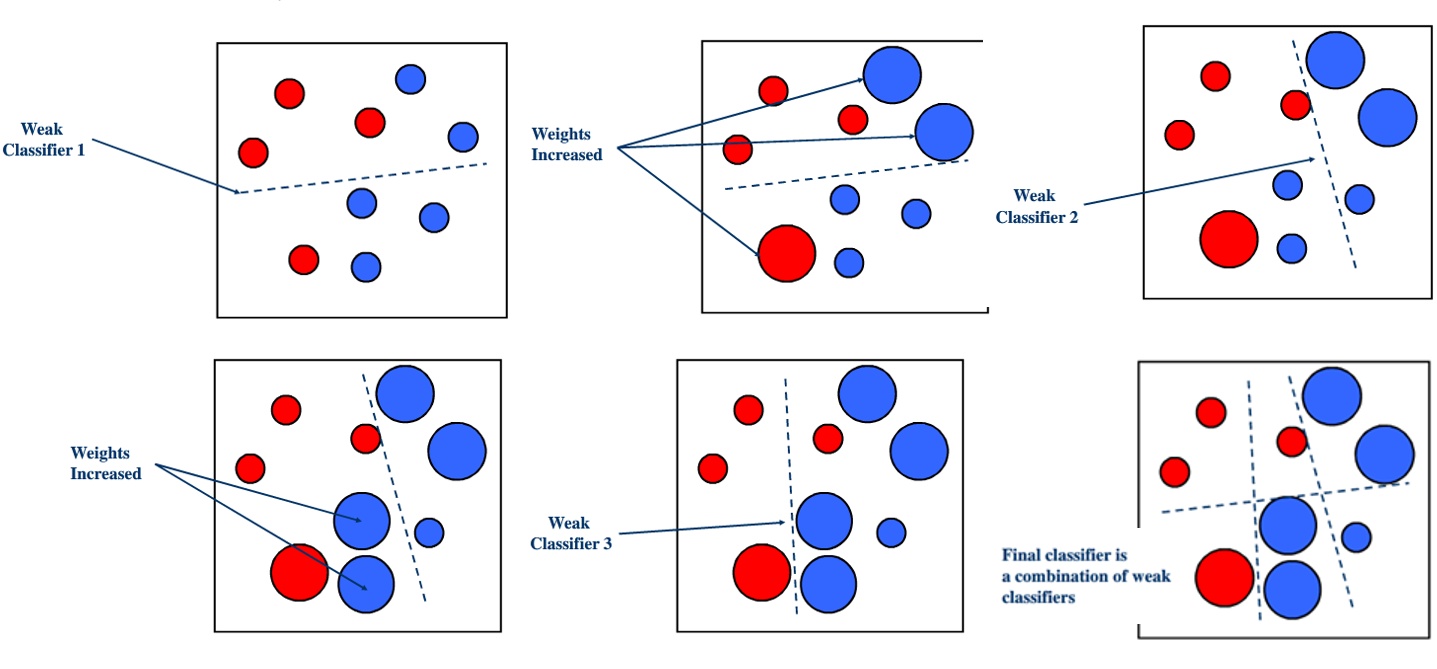
- boosting: eg. Gradient Boosting Machine(GBM), AdaBoost
- GBM variant: LightGBM, Extreme Gradient Boosting(XGBoost)
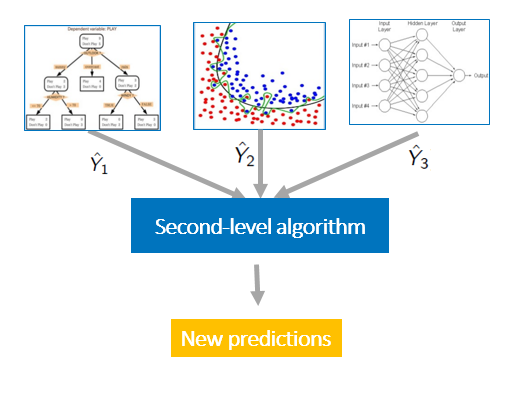
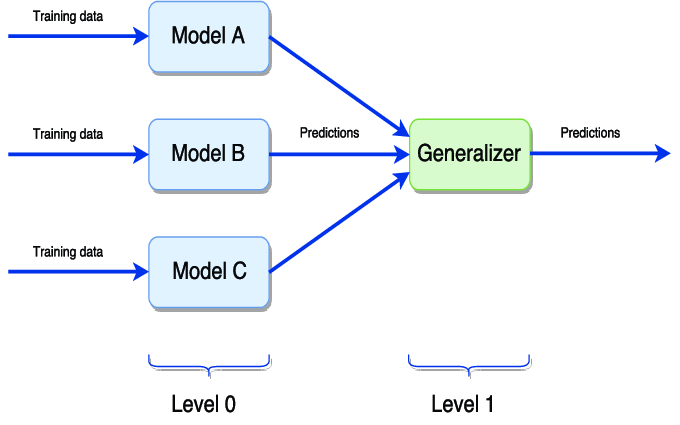
- stacking
others
- binning
- blending
- averaging
- voting
see What is the difference between Bagging and Boosting?
see 集成学习-Boosting,Bagging与Stacking
boostrap aggregating/bagging
boosting
model stacking
Model Tuning
decision trees
- information gain: IG 信息增益
- gini impurity: GI 基尼不纯度
bias-variance tradeoff
The main causes of error in learning are due to noise, bias and variance.
extreme cases of bias-variance
- underfitting: higt bias, low variance
- overfitting: lower bias, high vairance
bias-variance tradeoff
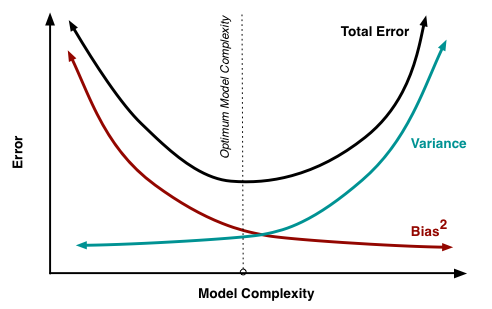
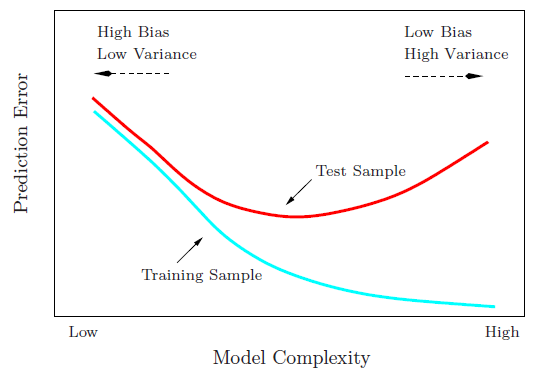
see learnopencv
cross validation
train/validation/test
cross validation strategies:
- leave one out CV: n-1 samples as train, 1 sample as validate
- k-fold CV: split into k equal subsets. k-1 subsets as train, 1 subset as validate
5-fold, 10-fold in pratice
hyperparameter tuning strategies
- grid search: manually specifying the grid, parallelizable
- randomized search: automatic
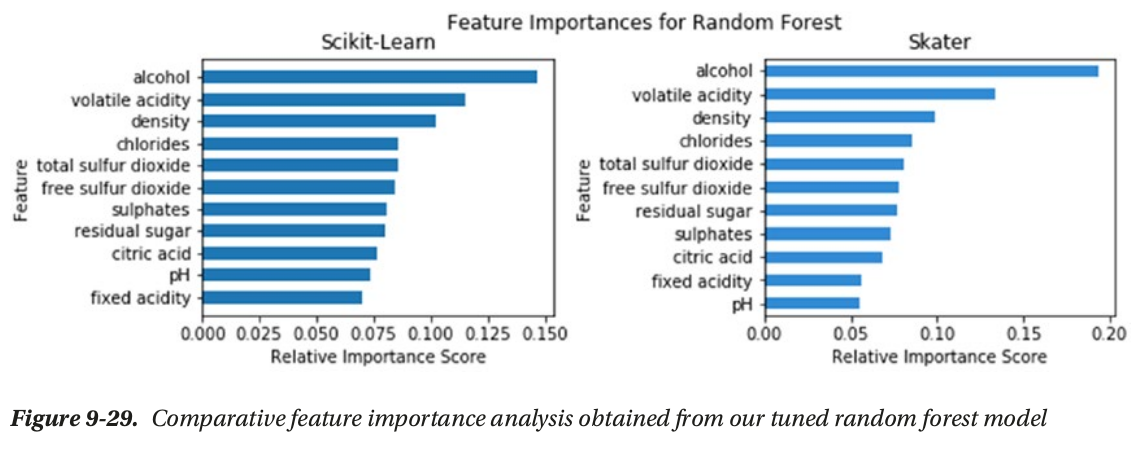
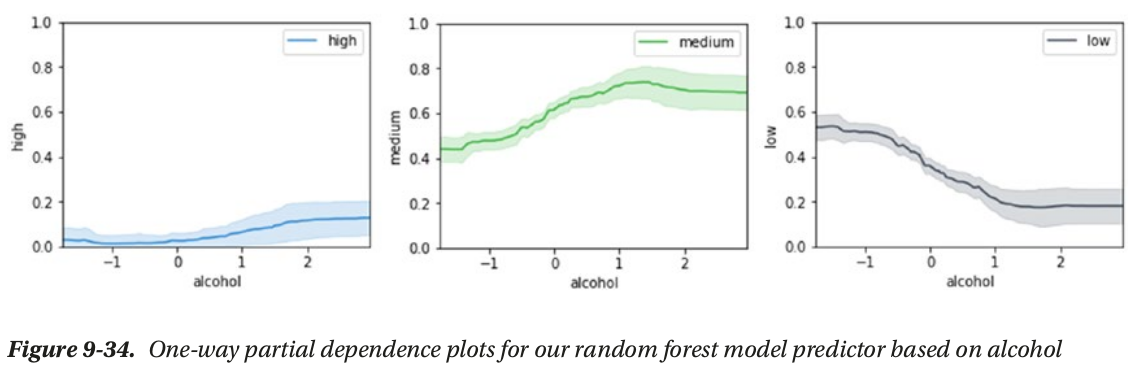
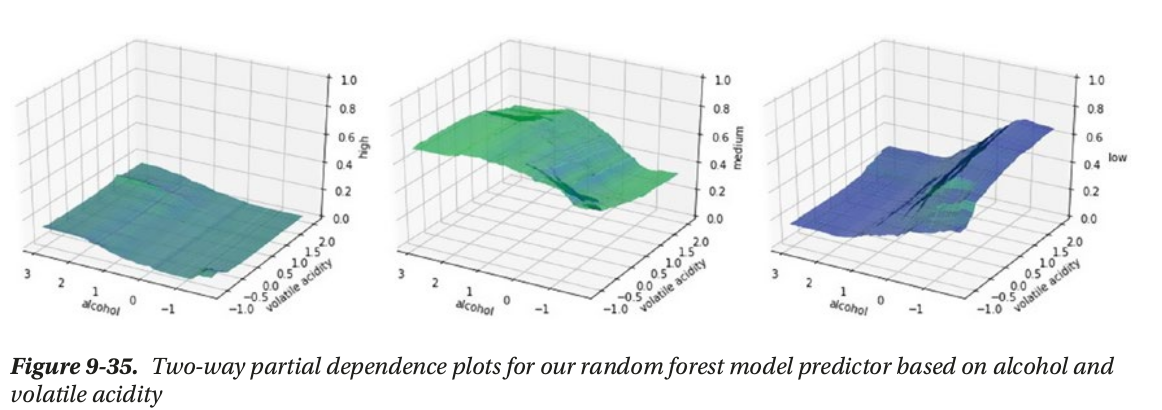
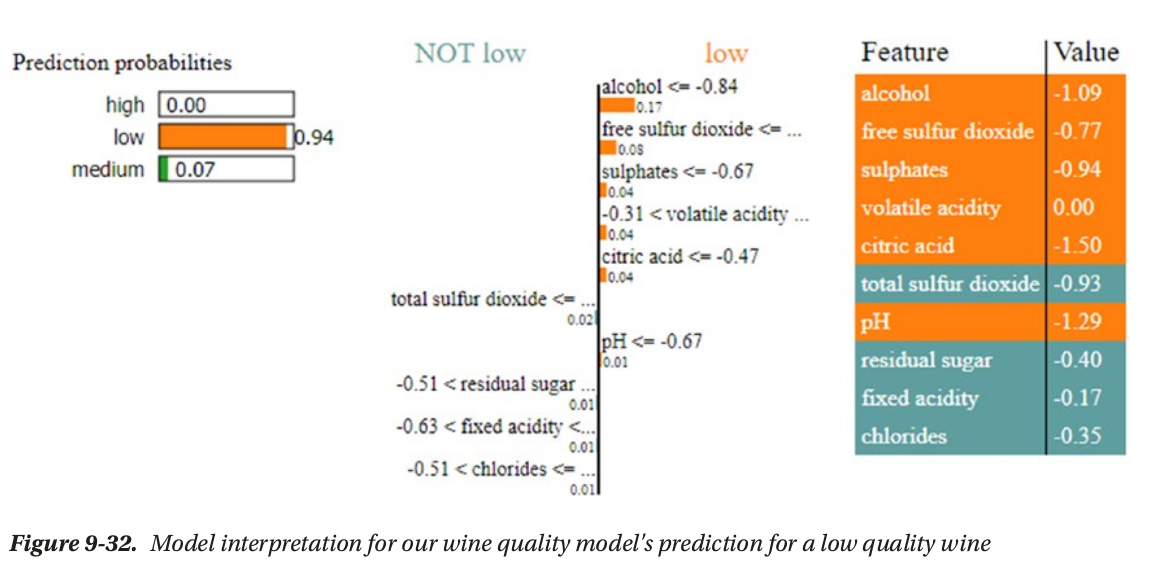
Model Interpertation
tools
global vs local interpertation
- global interpertation: based on the whole dataset (feature_importance, partial_dependence plot)
- local interpertation: based on a single prediction
global interpertation
local interpertation
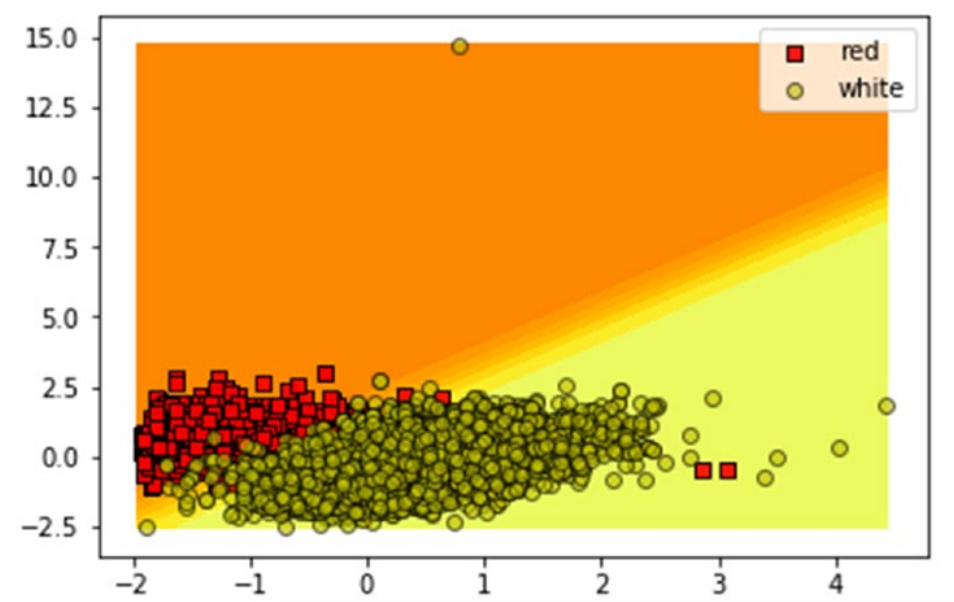
model decision surface/ hypersurface
Model Deployment
- rest api
- micro service
- model deployment as a service, anything as a service(XAAS)
Real-world case studies
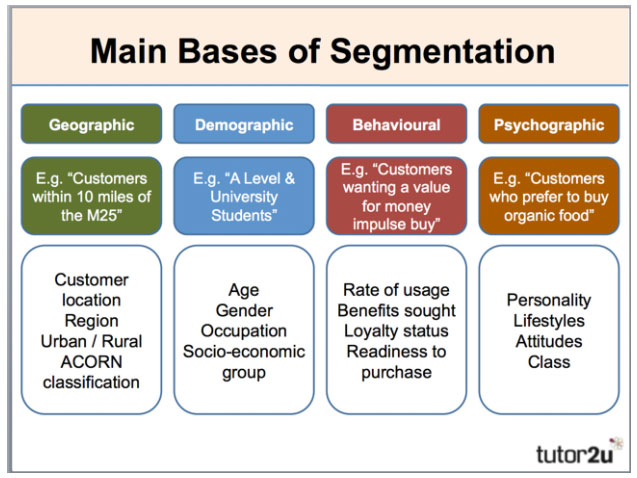
customer segmentation
clustering problem
factors
- geographic 地理因素
- demographic 人口统计因素
- psychographic 心理因素
- behavioural 行为因素
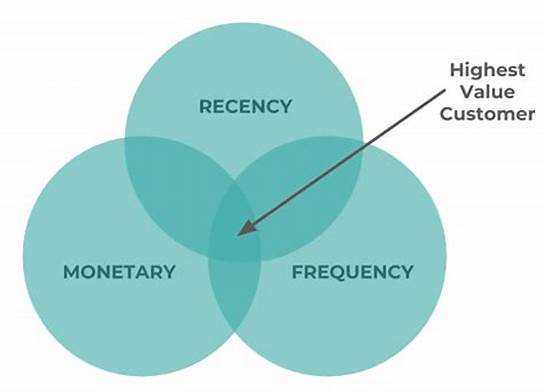
RFM Model for customer value
- recency
- frequency
- monetary value
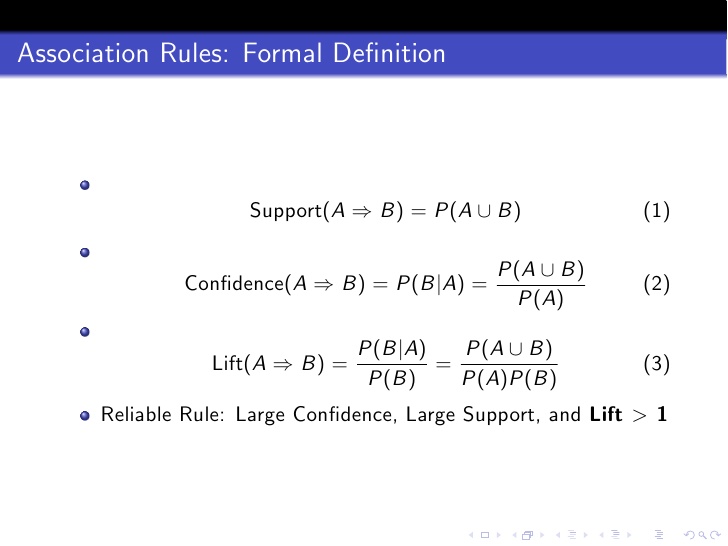
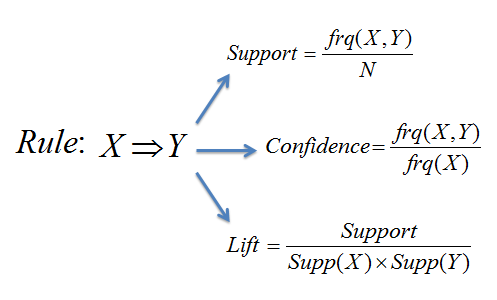
association-rule mining
assiciation rule-mining/market basket analysis(购物篮分析)
basics
- association rule: {item1,item2,item3 —> itemK}
- itemset: {milk,bread} {beer,diaper}
- frequent itemset: {milk,bread}
metrics
- support = frq(X,Y)/N
- confidence = support(X,Y)/support(X) = frq(X,Y)/frq(X)
- lift = support(X,Y)/(support(X)*support(Y)) = N*frq(X,Y)/(frq(X)*frq(Y))
good rules: large confidence, large support, lift >1
lift(X->Y) = 0 means X and Y not occur at the same time
lift(X->Y) = 1 means X and Y are independent of each other.
algorithms
- apriori algorithm: generate all 2^k itemsets, TOO EXPENSIVE
- FP growth: no need to generate all 2^k itemsets, use special structure FP-tree, divide-and-conquer stragety
k unique products, then 2^k itemsets.
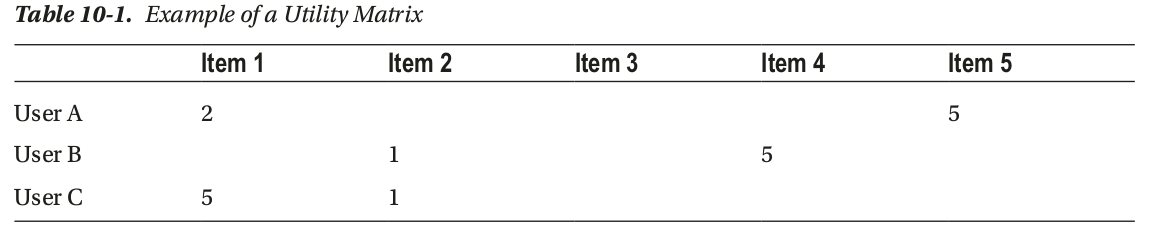
recommender system
recommender systems/ recommendation engines
big data with pandas
how to process big data with pandas ?
import pandas as pd
for chunk in pd.read_csv(<filepath>, chunksize=<your_chunksize_here>)
    do_processing()
    train_algorithm()
read by chunk
see opening-a-20gb-file-for-analysis-with-pandas
other tools
other refs
types of recommendation engines
3 types
- user-based recommendation engines
- content-based recommendation engines
- hybrid/collaborative filtering(协同过滤) recommendation engines
based on similarity
different cases
- popularity-based: most liked songs by all users
- similarity-based: similar songs for given user
- matrix factorization based: use svd to get low rand approximation of the utility matrix
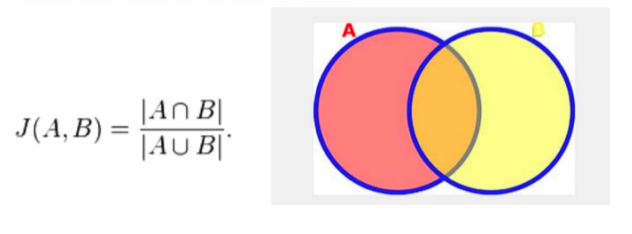
similarity
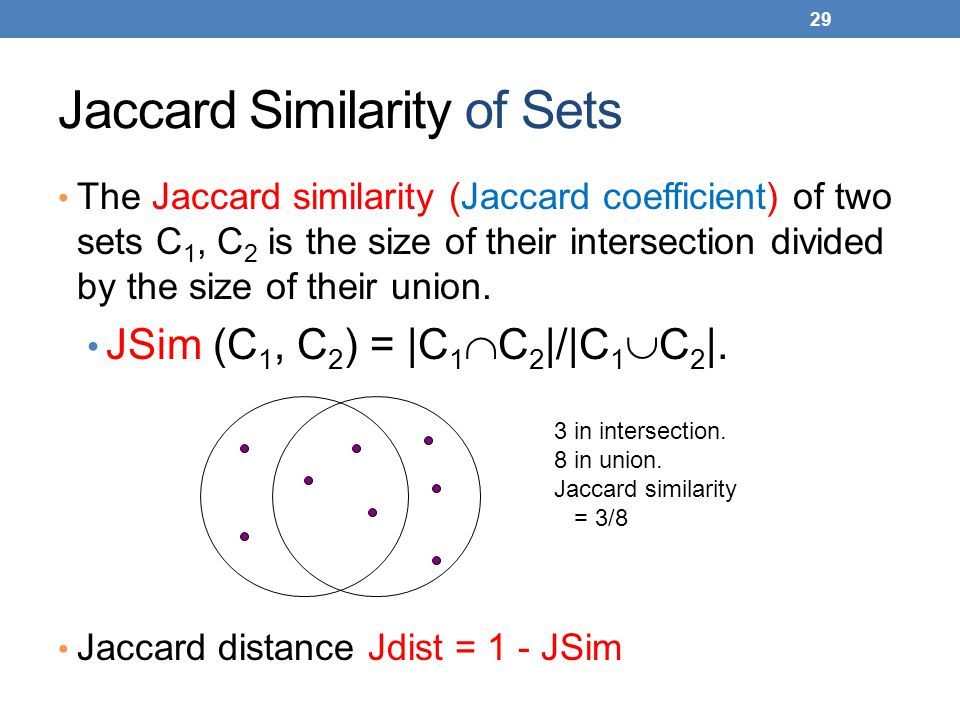
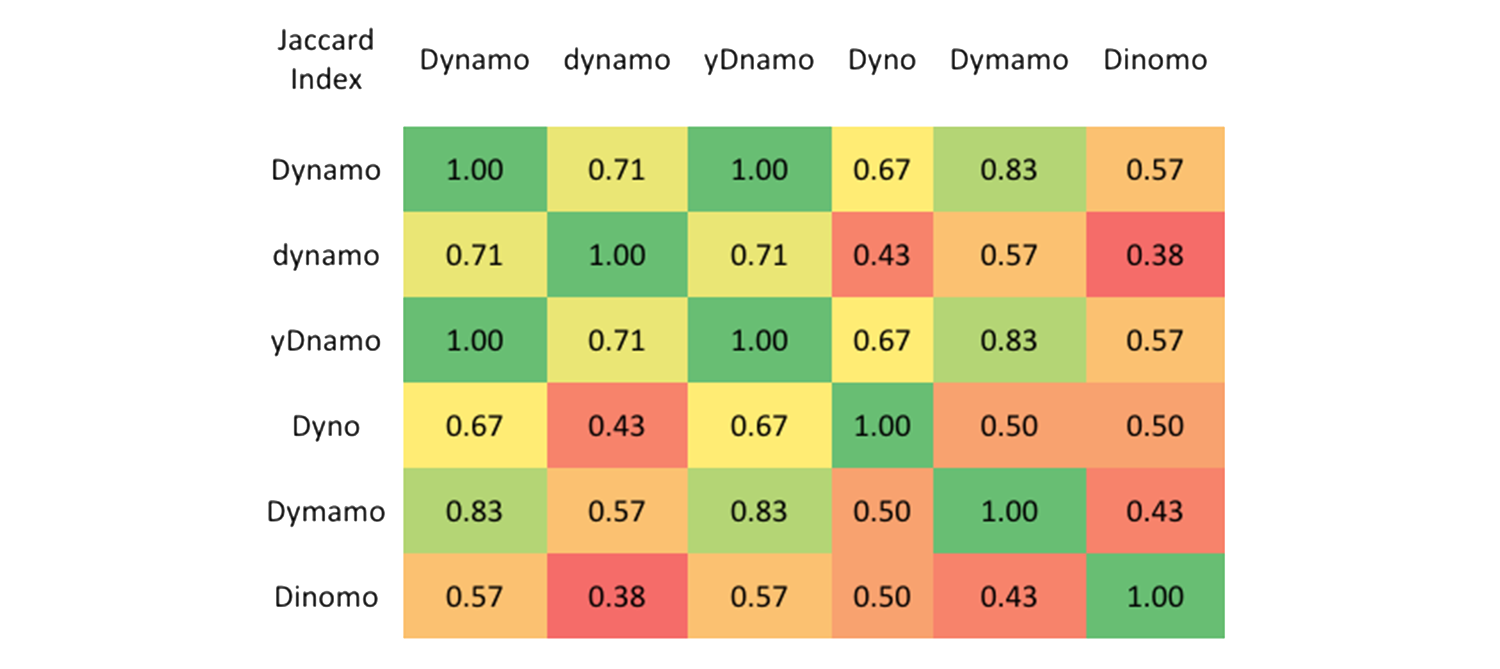
- Jaccard Index/Jaccard similarity coefficient, (0-1)
- cosine similarity
Jaccard Distance = 1 - Jaccard Index
matrix factorization
矩阵分解
use matrix factorization to discover latent features between two different kinds of entities
sparse matrix
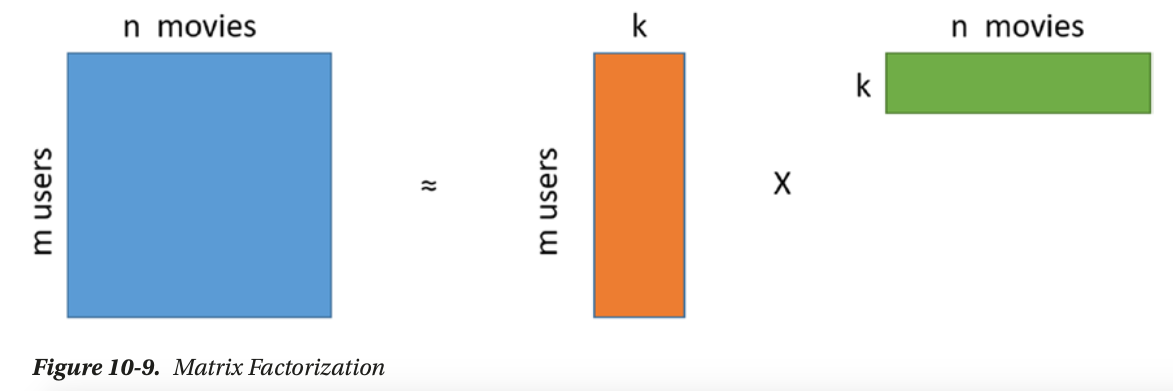
use SVD: matrix factorization, PCA
implicit feedback 隐式反馈: song play count—> likeness
recommendation engine libraries
- scikit-surprise (Simple Python Recommendation System Engine)
- lightfm
- crab
- rec_sys
time series forecasting
basics
predictive modeling
time series analysis/forecasting:
- traditional approaches
- Moving Average: MV
- Exponential Smoothing: EWMA
- Holt-Winter EWMA
- Box-jenkins methodologies: AR, MA, ARIMA, S-ARIMA
- deep learning approaches: RNN, eg. LSTM
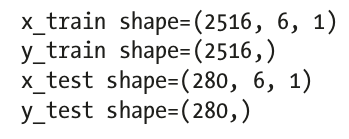
- regression modeling (x1,x2,..x6,—>x7): many-to-one
- sequence modeling: squence -> sequence
two domains
- frequency domain: spectral and wavelet analysis
- time domain: auto- and cross-correlation analysis
where to get data ?
tools to fetch data:
- quandl: register for key first
- pandas-datareader
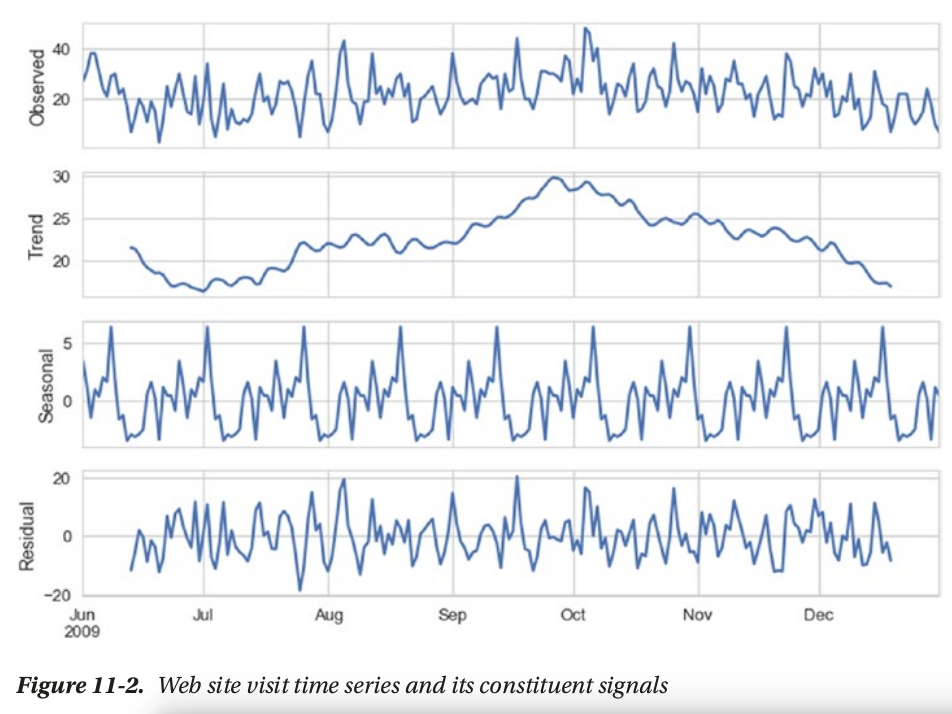
time series components
3 major components:
- seasonality
- trend
- residual
smoothing techniques
- Moving Average: MV
- Exponential Smoothing: EWMA
ARIMA
AR vs MV
- auto regressive
- moving average
ARIMA: auto regressive integrated moving average
key concepts
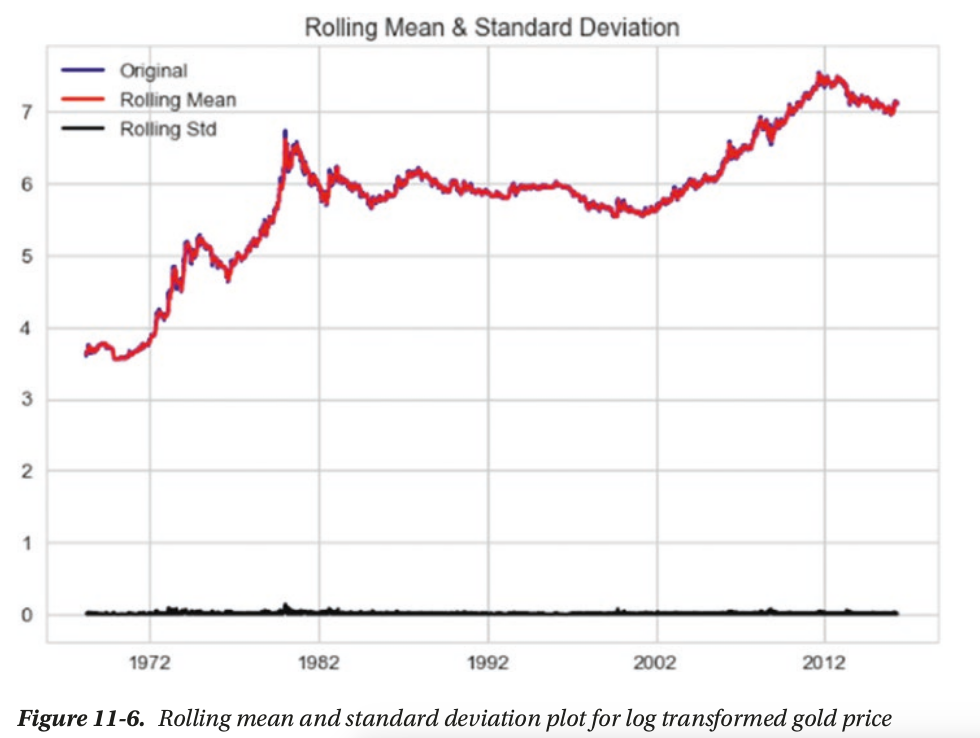
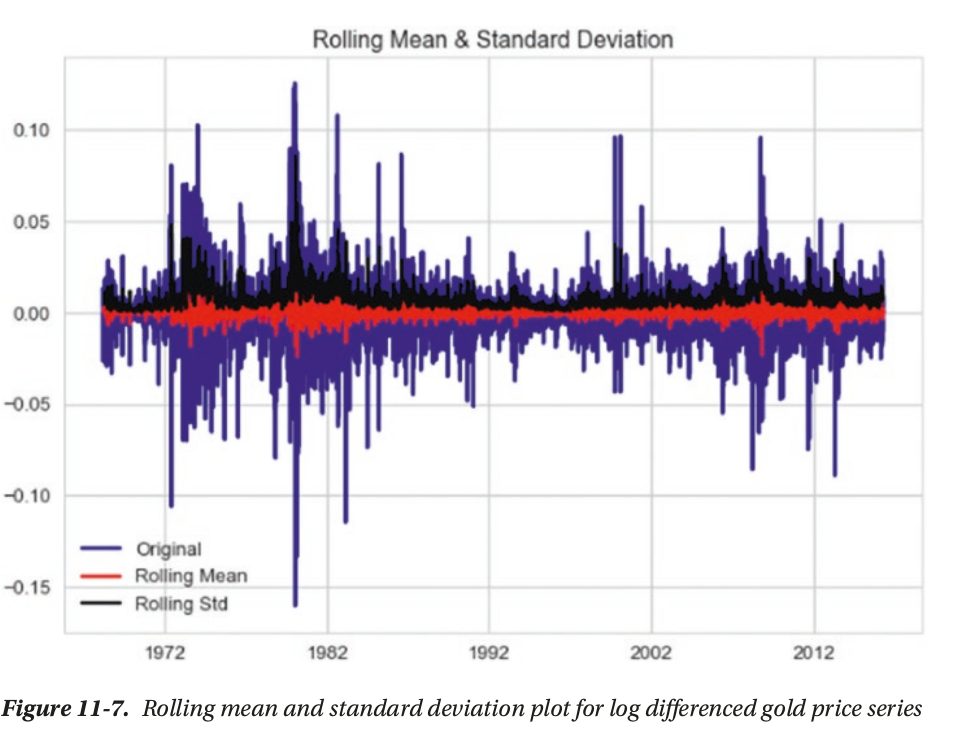
- Stationarity(平稳性): One the key assumptions behind the ARIMA models. Stationarity refers to the property where for a time series its mean, variance, and autocorrelation are time invariant. In other words, mean, variance,and autocorrelation do not change with time
- Differencing(差分): differencing is widely used to stabilize the mean of a time series. We can then apply different tests to confirm if the resulting series is stationary or not.
- Unit Root Tests: Statistical tests that help us understand if a given series is stationary
or not.
ad_fuller_test: The Augmented Dickey Fuller test begins with a null hypothesis of series being non-stationarykpss_test: while Kwiatkowski-Phillips-Schmidt-Shin test or KPSS has a null hypothesis that the series is stationary.
ad_fuller_test
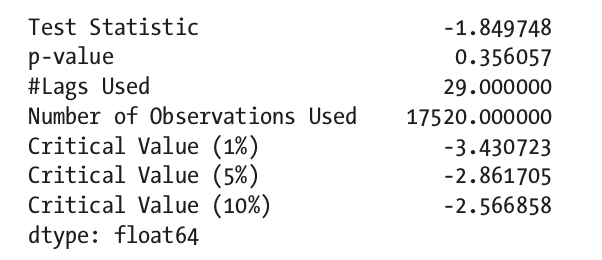
not statistically significant, accpet H0: non-stationary
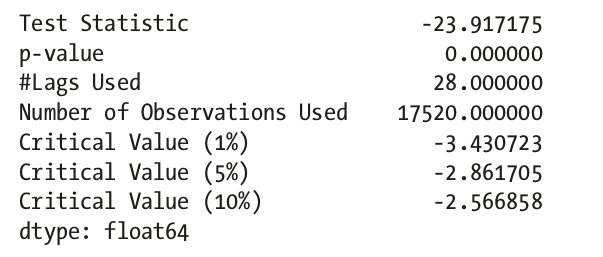
statistically significant, reject H0 and accept Ha: stationary
ARIMA(p,d,q) model
where,
- p is the order of Autoregression
- q is the order of Moving average
- d is the order of differencing
how to choose p and q?
- ACF or Auto Correlation Function plot —> q = 1
- PACF or the Partial Auto Correlation Function plot —> p = 1
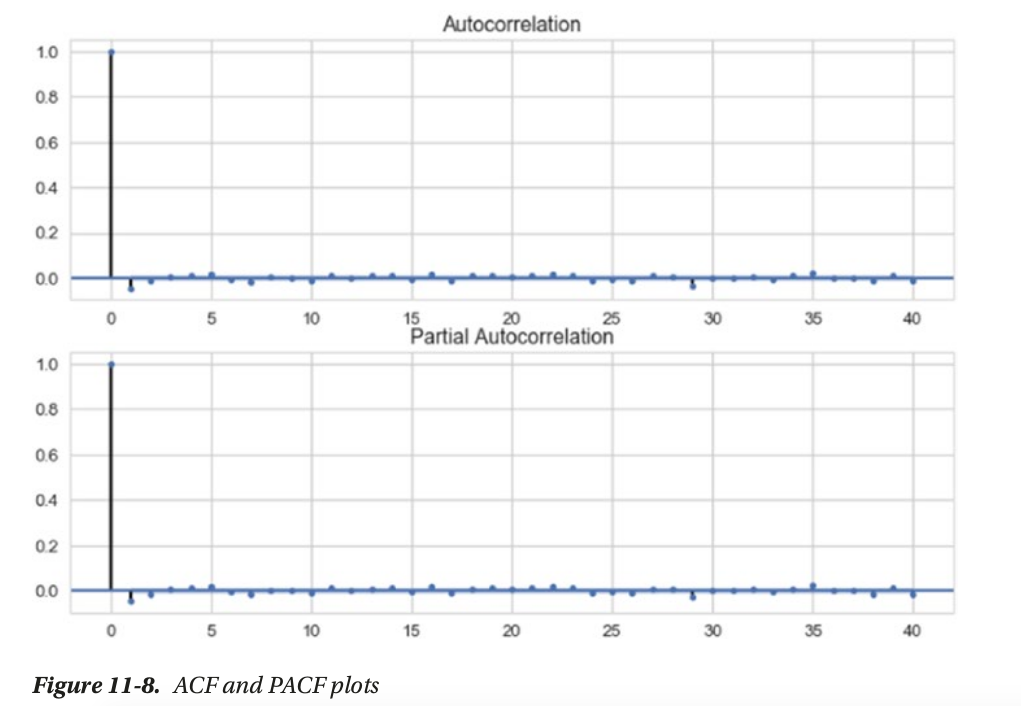
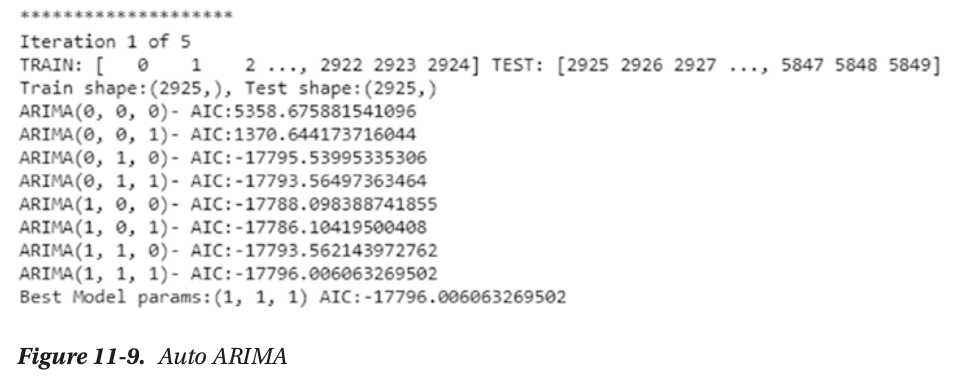
use grid search to choose p and q based on AIC
AIC or Akaike Information Criterion measures the
goodness of fit and parsimony.
LSTM
Efficient Market Hypothesis: which says that it is almost impossible to beat the market consistently and there
are others which disagree with it.
modeling
- regression modeling
- sequence modeling
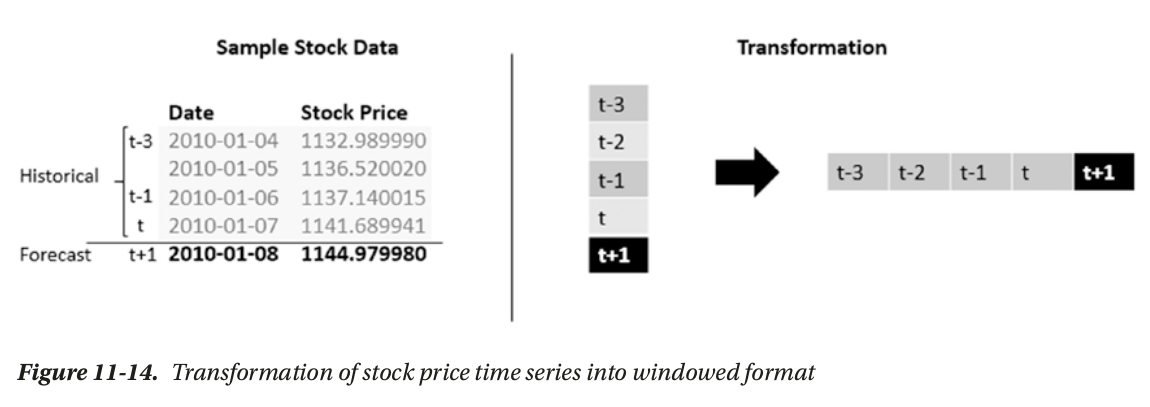
(N,W,F) format as input
- number of sequence
- window: length of sequence
- features per timestamp
for regression
for sequence
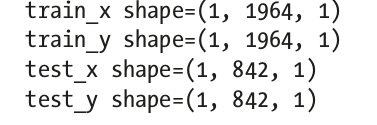
we need to pad test sequence to match input shape.
other time series tools
New Concepts
- Linear Discriminant Analysis(LDA)线性判别分析
- Quadratic Discriminant Analysis(QDA)线性判别分析
sklearn code
from sklearn.discriminant_analysis import QuadraticDiscriminantAnalysis
Reference
History