R-CNN
introduction
R-CNN is a state-of-the-art detector that classifies region proposals by a finetuned Caffe model. For the full details of the R-CNN system and model, refer to its project site and the paper:
Rich feature hierarchies for accurate object detection and semantic segmentation. Ross Girshick, Jeff Donahue, Trevor Darrell, Jitendra Malik. CVPR 2014. Arxiv 2013.
In this example, we do detection by a pure Caffe edition of the R-CNN model for ImageNet. The R-CNN detector outputs class scores for the 200 detection classes of ILSVRC13. Keep in mind that these are raw one vs. all SVM scores, so they are not probabilistically calibrated or exactly comparable across classes. Note that this off-the-shelf model is simply for convenience, and is not the full R-CNN model.
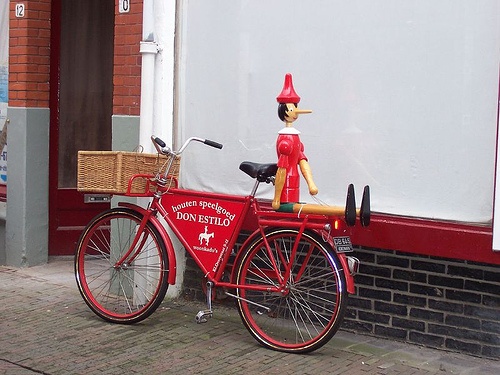
Let’s run detection on an image of a bicyclist riding a fish bike in the desert (from the ImageNet challenge—no joke).
selective search
First, we’ll need region proposals and the Caffe R-CNN ImageNet model:
Selective Search is the region proposer used by R-CNN. The selective_search_ijcv_with_python Python module takes care of extracting proposals through the selective search MATLAB implementation.
clone repo
cd $CAFFE_ROOT/caffe/python
git clone https://github.com/sergeyk/selective_search_ijcv_with_python.git`

pip install tables
install matlab
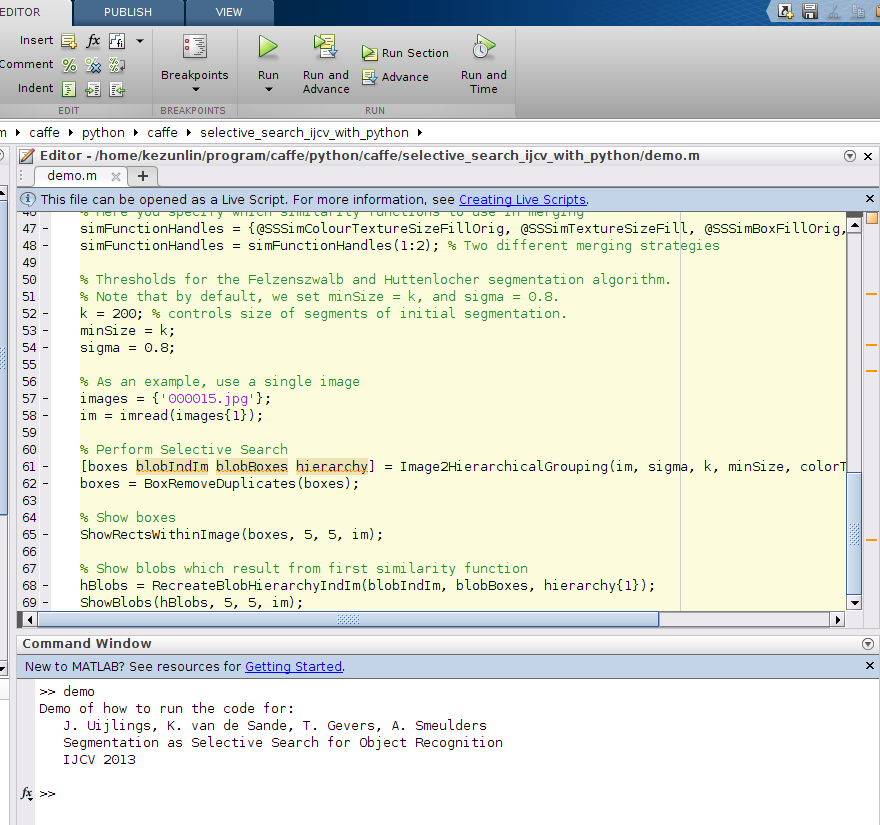
Install matlab and run demo.m file to compile functions
see here
Notice: Restart computer for Solving Errors:
OSError: [Errno 2] No such file or directory
compile matlab functions
cd caffe/python/caffe/selective_search_ijcv_with_python
which matlab
#/opt/MATLAB/R2016b/bin/matlab

matlab demo.m
run demo in matlab
origin image
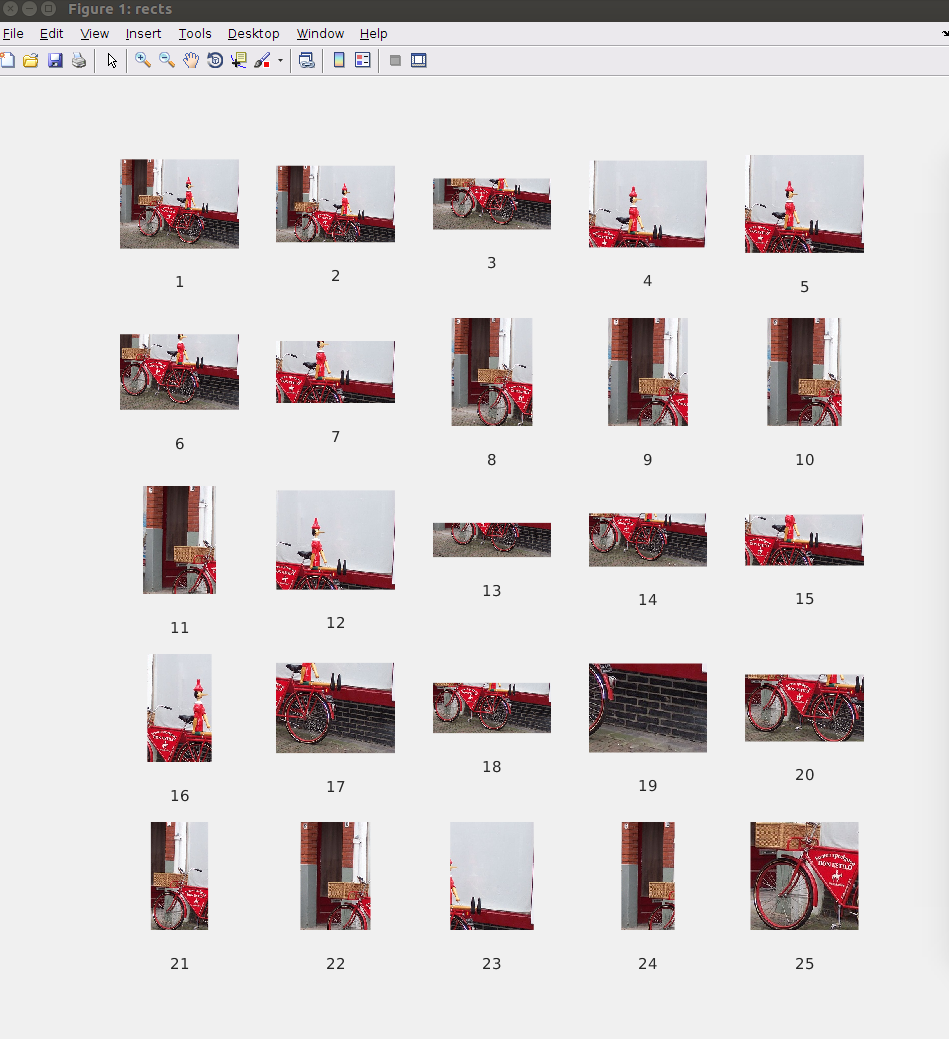
region results
detect regions
Run scripts to get the Caffe R-CNN ImageNet model.
./scripts/download_model_binary.py models/bvlc_reference_rcnn_ilsvrc13
With that done, we’ll call the bundled detect.py to generate the region proposals and run the network. For an explanation of the arguments, do ./detect.py --help.
cd caffe/examples/
mkdir -p _temp
echo `pwd`/images/fish-bike.jpg > _temp/det_input.txt
../python/detect.py --crop_mode=selective_search --pretrained_model=../models/bvlc_reference_rcnn_ilsvrc13/bvlc_reference_rcnn_ilsvrc13.caffemodel --model_def=../models/bvlc_reference_rcnn_ilsvrc13/deploy.prototxt --gpu --raw_scale=255 _temp/det_input.txt _temp/det_output.h5
...
I1129 15:02:22.498908  3483 net.cpp:242] This network produces output fc-rcnn
I1129 15:02:22.498919  3483 net.cpp:255] Network initialization done.
I1129 15:02:22.577332  3483 upgrade_proto.cpp:53] Attempting to upgrade input file specified using deprecated V1LayerParameter: ../models/bvlc_reference_rcnn_ilsvrc13/bvlc_reference_rcnn_ilsvrc13.caffemodel
I1129 15:02:22.685262  3483 upgrade_proto.cpp:61] Successfully upgraded file specified using deprecated V1LayerParameter
I1129 15:02:22.685796  3483 upgrade_proto.cpp:67] Attempting to upgrade input file specified using deprecated input fields: ../models/bvlc_reference_rcnn_ilsvrc13/bvlc_reference_rcnn_ilsvrc13.caffemodel
I1129 15:02:22.685804  3483 upgrade_proto.cpp:70] Successfully upgraded file specified using deprecated input fields.
W1129 15:02:22.685809  3483 upgrade_proto.cpp:72] Note that future Caffe releases will only support input layers and not input fields.
Loading input...
selective_search_rcnn({'/home/kezunlin/program/caffe/examples/images/fish-bike.jpg'}, '/tmp/tmpkOe6J0.mat')
/home/kezunlin/program/caffe/python/caffe/detector.py:140: VisibleDeprecationWarning: using a non-integer number instead of an integer will result in an error in the future
  crop = im[window[0]:window[2], window[1]:window[3]]
/home/kezunlin/program/caffe/python/caffe/detector.py:174: VisibleDeprecationWarning: using a non-integer number instead of an integer will result in an error in the future
  context_crop = im[box[0]:box[2], box[1]:box[3]]
/usr/local/lib/python2.7/dist-packages/skimage/transform/_warps.py:84: UserWarning: The default mode, 'constant', will be changed to 'reflect' in skimage 0.15.
  warn("The default mode, 'constant', will be changed to 'reflect' in "
/home/kezunlin/program/caffe/python/caffe/detector.py:177: VisibleDeprecationWarning: using a non-integer number instead of an integer will result in an error in the future
  crop[pad_y:(pad_y + crop_h), pad_x:(pad_x + crop_w)] = context_crop
Processed 1565 windows in 15.899 s.
/usr/local/lib/python2.7/dist-packages/pandas/core/generic.py:1299: PerformanceWarning:
your performance may suffer as PyTables will pickle object types that it cannot
map directly to c-types [inferred_type->mixed,key->block1_values] [items->['prediction']]

  return pytables.to_hdf(path_or_buf, key, self, **kwargs)
Saved to _temp/det_output.h5 in 0.082 s.
This run was in GPU mode. For CPU mode detection, call detect.py without the --gpu argument.
process regions
Running this outputs a DataFrame with the filenames, selected windows, and their detection scores to an HDF5 file.
(We only ran on one image, so the filenames will all be the same.)
import numpy as np
import pandas as pd
import matplotlib.pyplot as plt
%matplotlib inline

df = pd.read_hdf('_temp/det_output.h5', 'df')
print(df.shape)
row = df.iloc[0] # prediction(200,), bbox as input image
print 'row ',row.shape
print 'prediction ',row[0].shape
print type(row)  # class 'pandas.core.series.Series
print row
(1565, 5)
row  (5,)
prediction  (200,)
<class 'pandas.core.series.Series'>
prediction    [-2.60202, -2.87814, -3.0061, -2.77251, -2.077...
ymin                                                    152.958
xmin                                                    159.692
ymax                                                    261.702
xmax                                                    340.586
Name: /home/kezunlin/program/caffe/examples/images/fish-bike.jpg, dtype: object
1570 regions were proposed with the R-CNN configuration of selective search. The number of proposals will vary from image to image based on its contents and size – selective search isn’t scale invariant.
In general, detect.py is most efficient when running on a lot of images: it first extracts window proposals for all of them, batches the windows for efficient GPU processing, and then outputs the results.
Simply list an image per line in the images_file, and it will process all of them.
Although this guide gives an example of R-CNN ImageNet detection, detect.py is clever enough to adapt to different Caffe models’ input dimensions, batch size, and output categories. You can switch the model definition and pretrained model as desired. Refer to python detect.py --help for the parameters to describe your data set. There’s no need for hardcoding.
Anyway, let’s now load the ILSVRC13 detection class names and make a DataFrame of the predictions. Note you’ll need the auxiliary ilsvrc2012 data fetched by data/ilsvrc12/get_ilsvrc12_aux.sh.
import numpy as np
import pandas as pd
import matplotlib.pyplot as plt
%matplotlib inline

#n01443537 goldfish
#n03445777 golf ball
#...
with open('../data/ilsvrc12/det_synset_words.txt') as f: # 200 classes from 1000 imagenet classes
    labels_df = pd.DataFrame([
        {
            'synset_id': l.strip().split(' ')[0],
            'name': ' '.join(l.strip().split(' ')[1:]).split(',')[0]
        }
        for l in f.readlines()
    ])
labels_df.sort_values(by='synset_id') # from a... to z
print labels_df.shape # (200, 2)
print labels_df.head(5)
(200, 2)
        name  synset_id
0  accordion  n02672831
1   airplane  n02691156
2        ant  n02219486
3   antelope  n02419796
4      apple  n07739125
#print type(df.prediction) # <class 'pandas.core.series.Series'>

print df.prediction.values.shape # numpy.ndarray (1565,)
print df.prediction.values[0].shape # numpy.ndarray (200,)

print np.vstack(df.prediction.values).shape # (1565, 200)

predictions_df = pd.DataFrame(np.vstack(df.prediction.values), columns=labels_df['name'])
#print predictions_df.values.shape # (1565, 200)
print(predictions_df.iloc[:5,:7])
(1565,)
(200,)
(1565, 200)
name  accordion  airplane       ant  antelope     apple  armadillo  artichoke
0     -2.602018 -2.878137 -3.006104 -2.772514 -2.077227  -2.590448  -2.414262
1     -2.997767 -3.312270 -2.878942 -3.434367 -2.227469  -2.492260  -2.383878
2     -2.476110 -3.145484 -2.377191 -2.684406 -2.289587  -2.428077  -2.390187
3     -2.362699 -2.784188 -1.981096 -2.664146 -2.207042  -2.299127  -2.181105
4     -2.929469 -2.323617 -2.755007 -3.165601 -2.188648  -2.486410  -2.505435
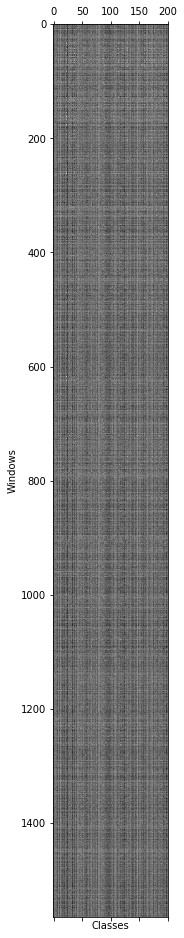
Let’s look at the activations.
plt.gray()
plt.matshow(predictions_df.values) # (1565, 200)
plt.xlabel('Classes')
plt.ylabel('Windows')
Now let’s take max across all windows and plot the top classes.
max_s = predictions_df.max(0)
max_s = max_s.sort_values(ascending=False)
print(max_s[:10])
name
person          1.839882
bicycle         0.855625
unicycle        0.085192
motorcycle      0.003604
turtle         -0.030388
banjo          -0.114999
electric fan   -0.220595
cart           -0.225192
lizard         -0.365949
helmet         -0.477555
dtype: float32
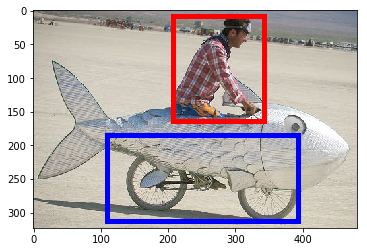
The top detections are in fact a person and bicycle.
Picking good localizations is a work in progress; we pick the top-scoring person and bicycle detections.
i = predictions_df['person'].argmax() # 70  rect
j = predictions_df['bicycle'].argmax()# 262 rect

# Show top predictions for top detection.
f = pd.Series(df['prediction'].iloc[i], index=labels_df['name']) # (200,)
#print f.head(5)
#print
print('Top detection:')
print(f.sort_values(ascending=False)[:5])
print('')

# Show top predictions for second-best detection.
f = pd.Series(df['prediction'].iloc[j], index=labels_df['name']) # (200,)
print('Second-best detection:')
print(f.sort_values(ascending=False)[:5])
Top detection:
name
person             1.839882
swimming trunks   -1.157806
turtle            -1.168884
tie               -1.217267
rubber eraser     -1.246662
dtype: float32

Second-best detection:
name
bicycle     0.855625
unicycle   -0.334367
scorpion   -0.824552
lobster    -0.965544
lamp       -1.076224
dtype: float32
# Find, print, and display the top detections: person and bicycle.
i = predictions_df['person'].argmax()
j = predictions_df['bicycle'].argmax()

# Show top predictions for top detection.
f = pd.Series(df['prediction'].iloc[i], index=labels_df['name'])
print('Top detection:')
print(f.sort_values(ascending=False)[:5])
print('')

# Show top predictions for second-best detection.
f = pd.Series(df['prediction'].iloc[j], index=labels_df['name'])
print('Second-best detection:')
print(f.sort_values(ascending=False)[:5])

# Show top detection in red, second-best top detection in blue.
im = plt.imread('images/fish-bike.jpg')
plt.imshow(im)
currentAxis = plt.gca()

det = df.iloc[i]
coords = (det['xmin'], det['ymin']), det['xmax'] - det['xmin'], det['ymax'] - det['ymin']
print coords # ((207.792, 7.6959999999999997), 134.71799999999999, 155.88200000000001)
currentAxis.add_patch(plt.Rectangle(*coords, fill=False, edgecolor='r', linewidth=5))

det = df.iloc[j]
coords = (det['xmin'], det['ymin']), det['xmax'] - det['xmin'], det['ymax'] - det['ymin']
print coords # ((108.706, 184.70400000000001), 284.78999999999996, 127.98399999999998)
currentAxis.add_patch(plt.Rectangle(*coords, fill=False, edgecolor='b', linewidth=5))
Top detection:
name
person             1.839882
swimming trunks   -1.157806
turtle            -1.168884
tie               -1.217267
rubber eraser     -1.246662
dtype: float32

Second-best detection:
name
bicycle     0.855625
unicycle   -0.334367
scorpion   -0.824552
lobster    -0.965544
lamp       -1.076224
dtype: float32
((207.792, 7.6959999999999997), 134.71799999999999, 155.88200000000001)
((108.706, 184.70400000000001), 284.78999999999996, 127.98399999999998)
That’s cool. Let’s take all ‘bicycle’ detections and NMS them to get rid of overlapping windows.
def nms_detections(dets, overlap=0.3):
    """
    Non-maximum suppression: Greedily select high-scoring detections and
    skip detections that are significantly covered by a previously
    selected detection.

    This version is translated from Matlab code by Tomasz Malisiewicz,
    who sped up Pedro Felzenszwalb's code.

    Parameters
    ----------
    dets: ndarray
        each row is ['xmin', 'ymin', 'xmax', 'ymax', 'score']
    overlap: float
        minimum overlap ratio (0.3 default)  >iou,then drop rect

    Output
    ------
    dets: ndarray
        remaining after suppression.
    """
    x1 = dets[:, 0]
    y1 = dets[:, 1]
    x2 = dets[:, 2]
    y2 = dets[:, 3]
    ind = np.argsort(dets[:, 4]) # current ind set (min--->max)

    w = x2 - x1
    h = y2 - y1
    area = (w * h).astype(float)
    """
    dets
    pick = []
    ind = [a,b,c,d,e,f]

    while not ind.empty:
        f, pick=[f],    ind=[a,b,c,d,e], o=[0.1,0.2,0.5,0.9,0.2],keep_ind=[0,1,4],ind=[a,b,e]
        e, pick=[f,e],  ind=[a,b],       o=[0.4,0.1],keep_ind=[1],ind=[b]
        b, pick=[f,e,b],ind=[],          o=[],       keep_ind=[], ind=[]
    return dets[pick]
    """

    pick = [] # pick index
    while len(ind) > 0:
        i = ind[-1] # choose last best index
        pick.append(i)
        ind = ind[:-1] # remove last one

        xx1 = np.maximum(x1[i], x1[ind])
        yy1 = np.maximum(y1[i], y1[ind])
        xx2 = np.minimum(x2[i], x2[ind])
        yy2 = np.minimum(y2[i], y2[ind])

        w = np.maximum(0., xx2 - xx1)
        h = np.maximum(0., yy2 - yy1)

        wh = w * h
        o = wh / (area[i] + area[ind] - wh) # [0.1,0.2,0.5,0.9,0.2]

        keep_ind = np.nonzero(o <= overlap)[0] # (array([0, 1, 4]),) ===>[0 1 4]
        ind = ind[keep_ind]

    return dets[pick, :]
scores = predictions_df['bicycle'] # (1565,)
windows = df[['xmin', 'ymin', 'xmax', 'ymax']].values # (1565, 4)
dets = np.hstack((windows, scores[:, np.newaxis])) # (1565, 4) (1565,1)===>(1565,5) xmin,ymin,xmax,ymax,score
nms_dets = nms_detections(dets,0.3)
print dets.shape # (1565, 5)
print nms_dets.shape # (181, 5)
(1565, 5)
(181, 5)
print nms_dets[:3]
[[ 108.706       184.704       393.496       312.688         0.85562503]
 [   0.           14.43        397.344       323.27         -0.73134482]
 [ 131.794       202.982       249.196       290.562        -1.26836455]]
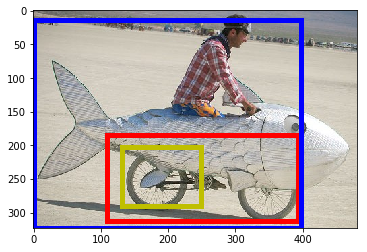
Show top 3 NMS’d detections for ‘bicycle’ in the image and note the gap between the top scoring box (red) and the remaining boxes.
plt.imshow(im)
currentAxis = plt.gca()
colors = ['r', 'b', 'y']
for c, det in zip(colors, nms_dets[:3]):
    currentAxis.add_patch(
        plt.Rectangle((det[0], det[1]), det[2]-det[0], det[3]-det[1],
        fill=False, edgecolor=c, linewidth=5)
    )
print 'scores:', nms_dets[:3, 4]
scores: [ 0.85562503 -0.73134482 -1.26836455]
This was an easy instance for bicycle as it was in the class’s training set. However, the person result is a true detection since this was not in the set for that class.
You should try out detection on an image of your own next!
(Remove the temp directory to clean up, and we’re done.)
!rm -rf _temp
Reference
History
- 20180816: created.